Jira Service Management 5.3.x release notes
29 September 2022
We're excited to present Jira Service Management 5.3.
Highlights
More
Read the upgrade notes for important details about this release and see the full list of issues resolved.
Compatible applications
If you're looking for compatible Jira applications, look no further:
Jira Service Management 5.3 has a known issue that is causing the Atlassian Jira Diagnostics app to create excess threads, which leads to a degradation in performance. In situations of elevated database activity — for example, during a full reindex — this may lead to the entire instance crashing.
We’ve already delivered a fix for this problem in Jira Service Management 5.4.0, which is available for download. The same fix will be backported to Jira Service Management 5.3.2.
Jira Service Management 5.3.0, 5.3.1 and 5.3.2 are affected by CVE-2023-22501. We've delivered a fix for this vulnerability in Jira Service Management 5.3.3, 5.4.2, 5.5.1, and 5.6.0, which are available for download. We recommend upgrading to a version of Jira Service Management that includes the fix for this issue.
Read the full security advisory for more information on this vulnerability
Help center column sorting DATA CENTER
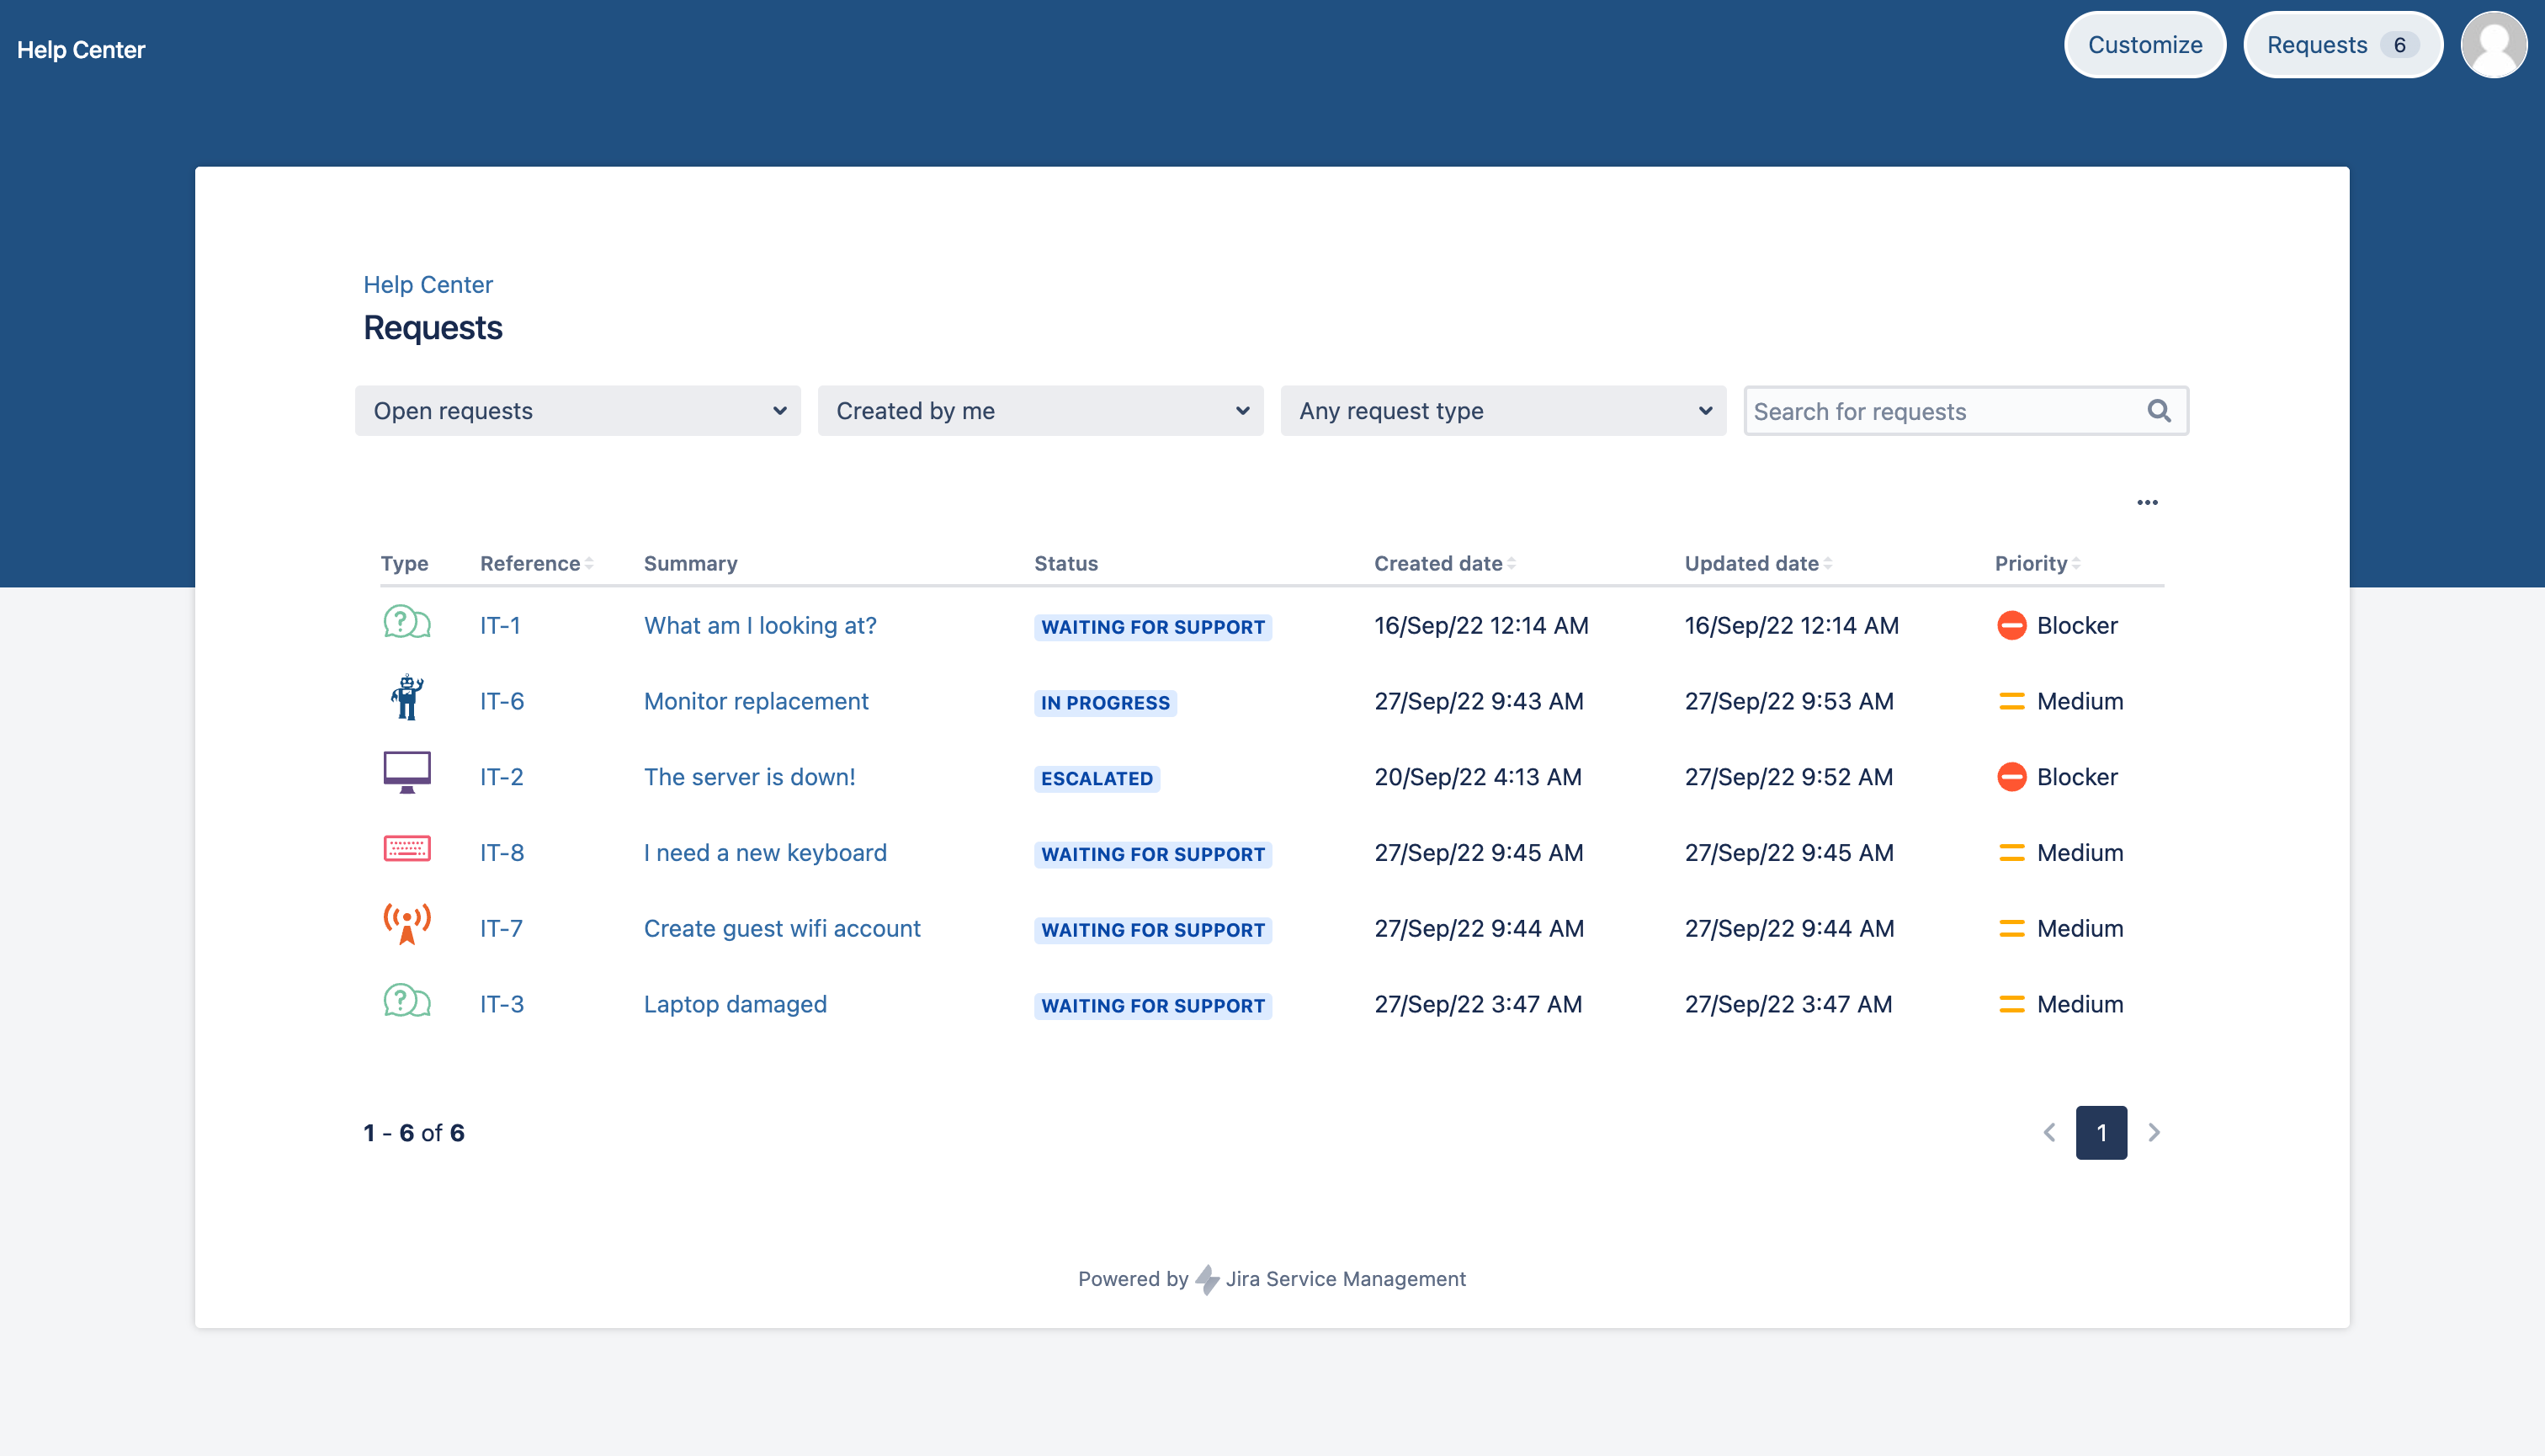
You can now sort columns in ascending and descending order on the My requests page in your Help center. This way you can adjust the visualization of the data on the page to your personal preferences, navigate through the data with ease, and find the values you need faster.
To sort the column, select its title. To change the sorting order, select the column title again. If you sort by any column other than Updated date, then your items will be sorted by that column, and then by the Updated date column, in descending order.
Here's what the updated Help center looks like:
Learn more about configuring your request view
Login-free customer portal DATA CENTER
The Help center experience was previously limited to users that were logged in. With the introduction of the login-free portal, all of your customers, even those with no account, can now access your customer portal. They can discover other available portals, read help articles, and raise requests—without logging in or creating an account. This feature supports help seekers in resolving their issues quickly.
There’s huge value in making the knowledge base more accessible, enabling self-service as the first step in the help seeker's workflow. The login-free portal will allow for a more informed and efficient service desk experience.
Learn more about the login-free portal
Insight is now Assets
We’re changing the name of the Jira Service Management asset management tool from Insight to Assets.
The functionality of the tool remains the same. But the rebranding has influenced the user interface and the tool-related marketplace apps, like Insight – Asset Management, Insight Discovery, Insight AWS Integration, and others.
Learn more about what’s changing.
Improved accessibility and user interface in Assets
We’ve enhanced the accessibility and user interface of Assets (formerly known as Insight) to provide a better user experience, higher usability, and seamless integration with Jira Service Management.
To upgrade Assets, we’ve used Jira Service Management accessibility standards and patterns. This approach has allowed us to narrow the disparity between the tool and Jira Service Management, and maintain consistency across the product.
The improvements to the accessibility features and user interface cover:
Building a more empowering and inclusive product
Improved support for the use of screen readers and keyboard
Fixing issues with the user interface that create blockers in functionality
Upgrading the design and content
Batching Assets database queries
Database queries executed during imports to Assets (formerly known as Insight) are now batched to improve the health of your Jira instance and overall import performance. Batching means that all data for each query is retrieved at once, instead of many individual select queries.
This feature impacts imports from all sources by optimizing the executing database queries to batch them together for an object where this is possible.
Here’s what will make your Jira’s performance grow:
Batch queries will save history data.
Delete operations will be batched up instead of being done one by one for attribute values.
Insert and update operations will be batched up to avoid executing one query for every attribute change.
Assets import offloading to the disk
In Assets (formerly known as Insight), Ehcache is now used to reduce memory consumption during imports and prevent process or machine crashes. This is possible since Ehcache allows for offloading large in-memory objects, created or used during imports, to the disk.
So, now there’s additional disk caching executed during an Assets import to offload large objects from the memory onto the machine’s disk.
The following feature lives in the Jira platform, which means it's available for Jira Software and Jira Service Management.
New database connectivity metrics available through JMX and log file
The new database connectivity metrics allow efficient instance diagnostics and timely resolution of performance issues. The metrics are available through JMX and a new log file atlassian-jira-ipd-monitoring.log.
The log file is available in the {jira_home}\log folder where you can find all the existing log files. The log file is also included in the Support Zip file. If needed, you can generate it in the Atlassian troubleshooting & support tools plugin and send the file to Atlassian Support. Learn more about the plugin.
Using database connectivity metrics, you’ll efficiently identify what in your environment or infrastructure might cause the performance issues. Early discovery of a problem guarantees that it can be fixed before its consequences have a bigger impact on instance operation.
To use the metrics, make sure you’ve enabled JMX. Read more about JMX in Jira.
Resolved issues
Issues resolved in 5.3.0
Released on 29 September 2022
Issues resolved in 5.3.1
Released on 25 October 2022
Issues resolved in 5.3.2
Released on 16 December 2022
Issues resolved in 5.3.3
Released on 19 January 2023
This release includes security updates and is recommended for all users.


