How to define Xmx based on GC logs
Pre-requisite knowledge
- Please refer to the following documentation on how to enable GC logging:
GC logging is enabled by default on the latest version of Jira and Confluence.
- The GC logs can be parsed by a GC Viewer; for example, you can use GCViewer. We are using GCViewer for the graphs below. An alternative tool would be GCeasy - this is an online tool and no download is required.
- There is some detailed explanation on this YouTube video:
https://www.youtube.com/watch?v=sSAHvuA0B40
How to read the graphs below
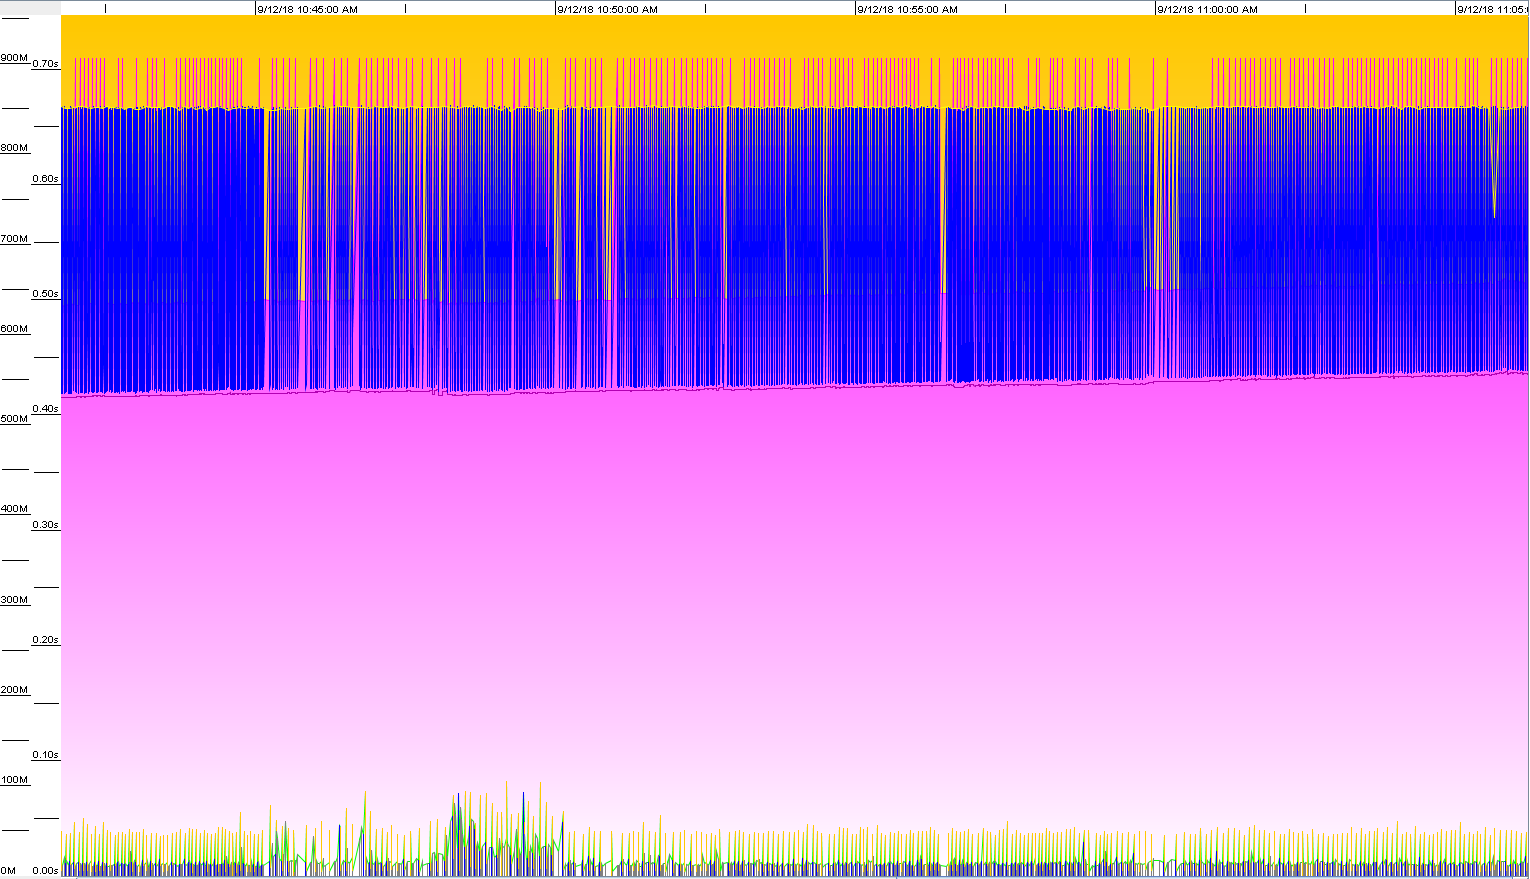
- The purple area in the graph below is the Tenured generation.
- The yellow area in the graph below is the Young generation.
- The blue lines are the heap is being used - they will be saw-toothed like lines (memory footprint). Heap will be used and minor GC will occur to clear the used heap. Some heap will be released causing the line to increase and decrease.
- There will be vertical black lines in the graph which indicates full GC. Full GC will stop the application. A full GC should not take longer than 3 to 5 seconds.
- Best practice for heap size:
- The Young generation size should not exceed more than half the total Java heap size. Typically, approximately 40% of the heap size is adequate.
- The memory footprint area (max and min of the saw-toothed like lines) should be around 40% of your total Java heap size. This is to avoid insufficient heap memory and also to avoid high CPU usage for GC. The balance here is to have enough heap memory for the application while having a healthy CPU load. Frequent full GC due to insufficient heap memory and/or long minor GC due to excessive heap allocation will spike your CPU load.
Info
GC logs below are from Jira 7.12.0 instance while creating 50000 issues, these are the action involved during the GC graphs below:
- Installation wizard.
- Login as Admin user.
- InstallDataGenerator plugin.
- Create a new project.
- Generate 50000 issues.
- Reindex 50000 issues.
For peak-hour GC simulation, you should look at the second half of the graphs below.
You should look at the graph during your Jira instance's peak-hour period.
This is just a simulation to show how we can determine the heap size needed based on the GC activities, the heap size values here are not a sizing guide for Jira.
Jira and Confluence only support parallel GC or G1GC.
Overview
When a Java program starts, Java Virtual Machine (JVM) will take some memory (RAM) from the Operating System. JVM uses this memory for various purposes and a huge part of this memory is called heap memory. Keeping it to a high-level overview, Java's heap allocation is represented by the following:
- Young Generation (Eden and Survivor), which consists of 40% of the heap.
- Old Generation (Tenured), which will take the remaining 60%.
When an object is created, it will get assigned to Eden. Once Eden starts to be filled up, a partial garbage collection will occur on the Young Generation. This process will mark all objects that are still in use, along with getting rid of the ones that are not. The in-use objects will then be promoted to Survivor. Once Survivor starts to be filled up, the same procedure will occur. Any objects that are still on use will go from Eden to Survivor, Survivor to Tenured (Old Generation) - the rest is discarded. Finally, when Tenured fills up, a full Garbage Collection will occur. This globally deletes all objects that are not in use.
In short, Java's GC will be responsible to keep the heap in a healthy state and make sure that all allocated objects are indeed being used.
How-to
To explain how we can define an Xmx based on GC logs, below are some example for different scenarios:
Parallel GC
This is the JVM’s default collector. It uses multiple threads to scan through and compact the heap memory. Parallel GC will stop the application threads during minor or full GC collection. If you use this GC algorithm on a huge heap memory (anything above 6 GB), the pauses will increase because it is designed to optimize for lower CPU overhead caused by the collector.
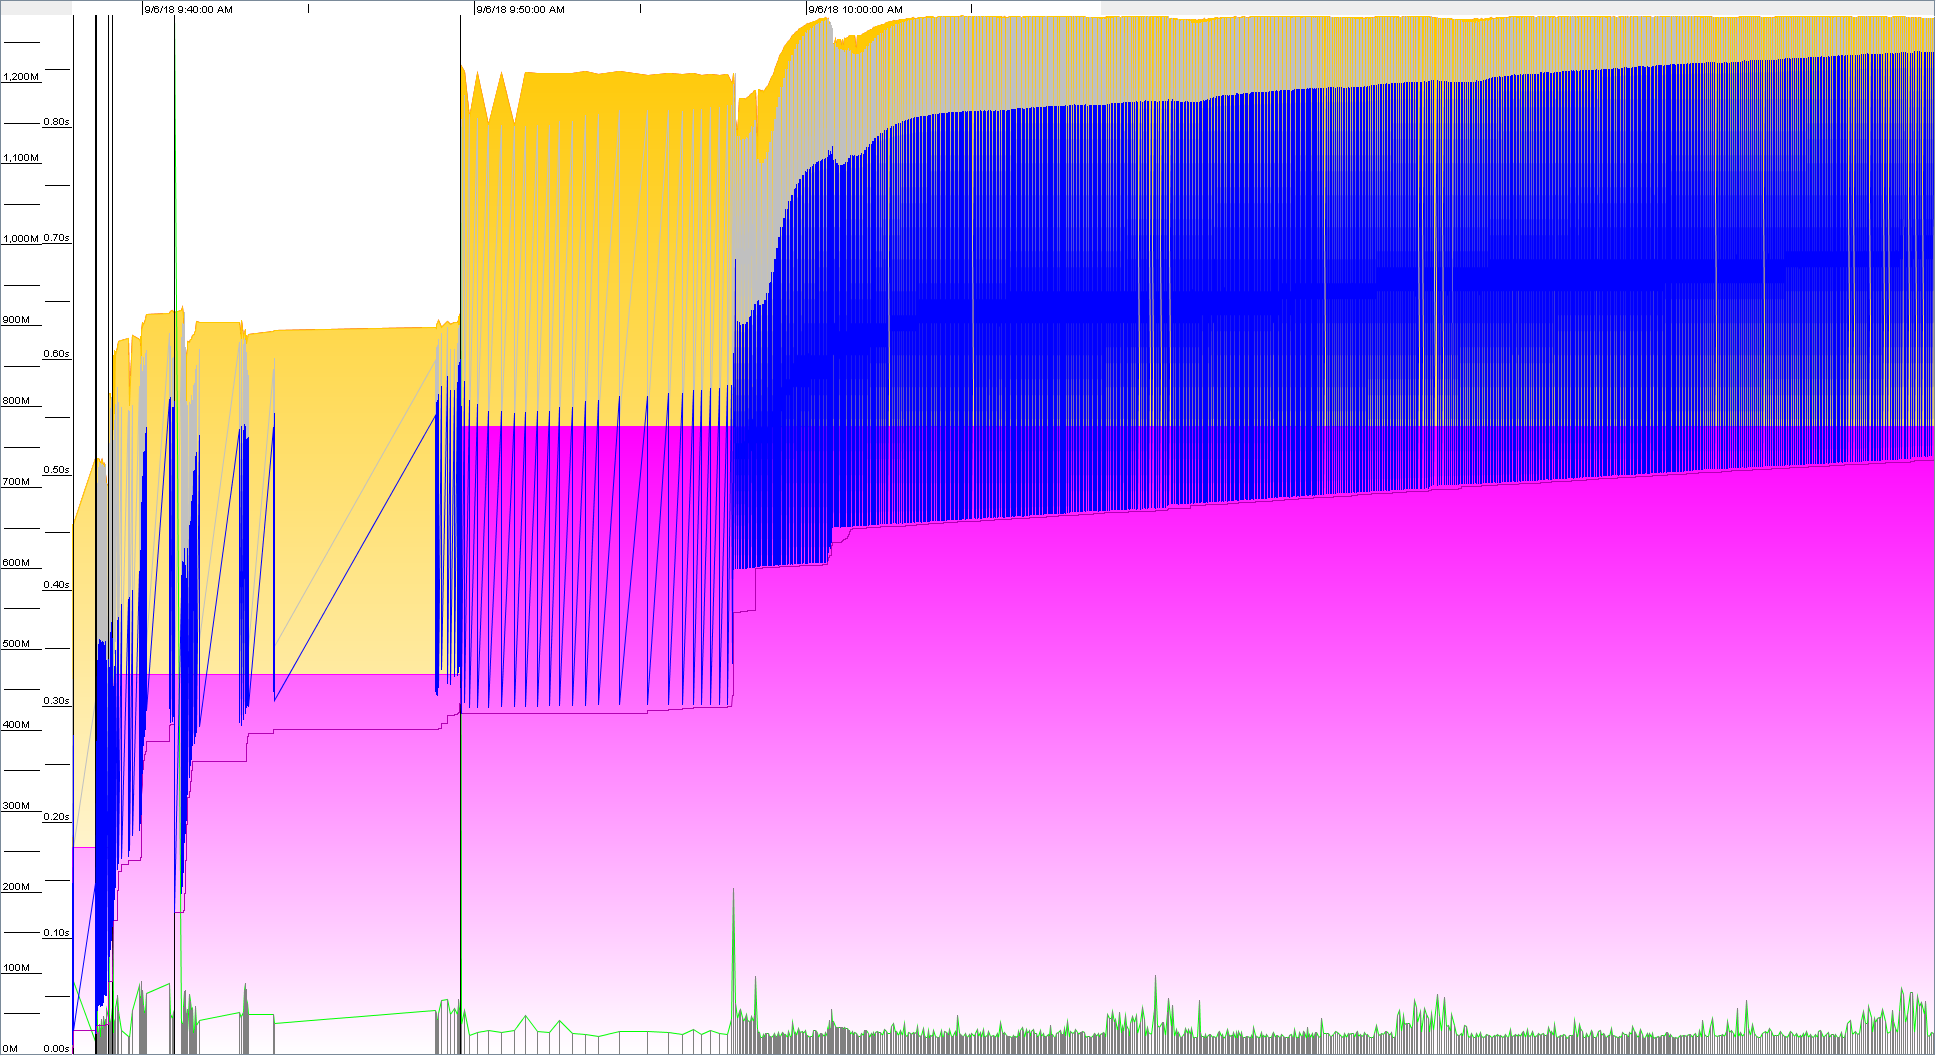
An optimum memory allocation
Xmx = 1536M
- The Young - Tenured Generation ratio is about 40% - 60%.
- The memory footprint area is about 40% of the total heap size.
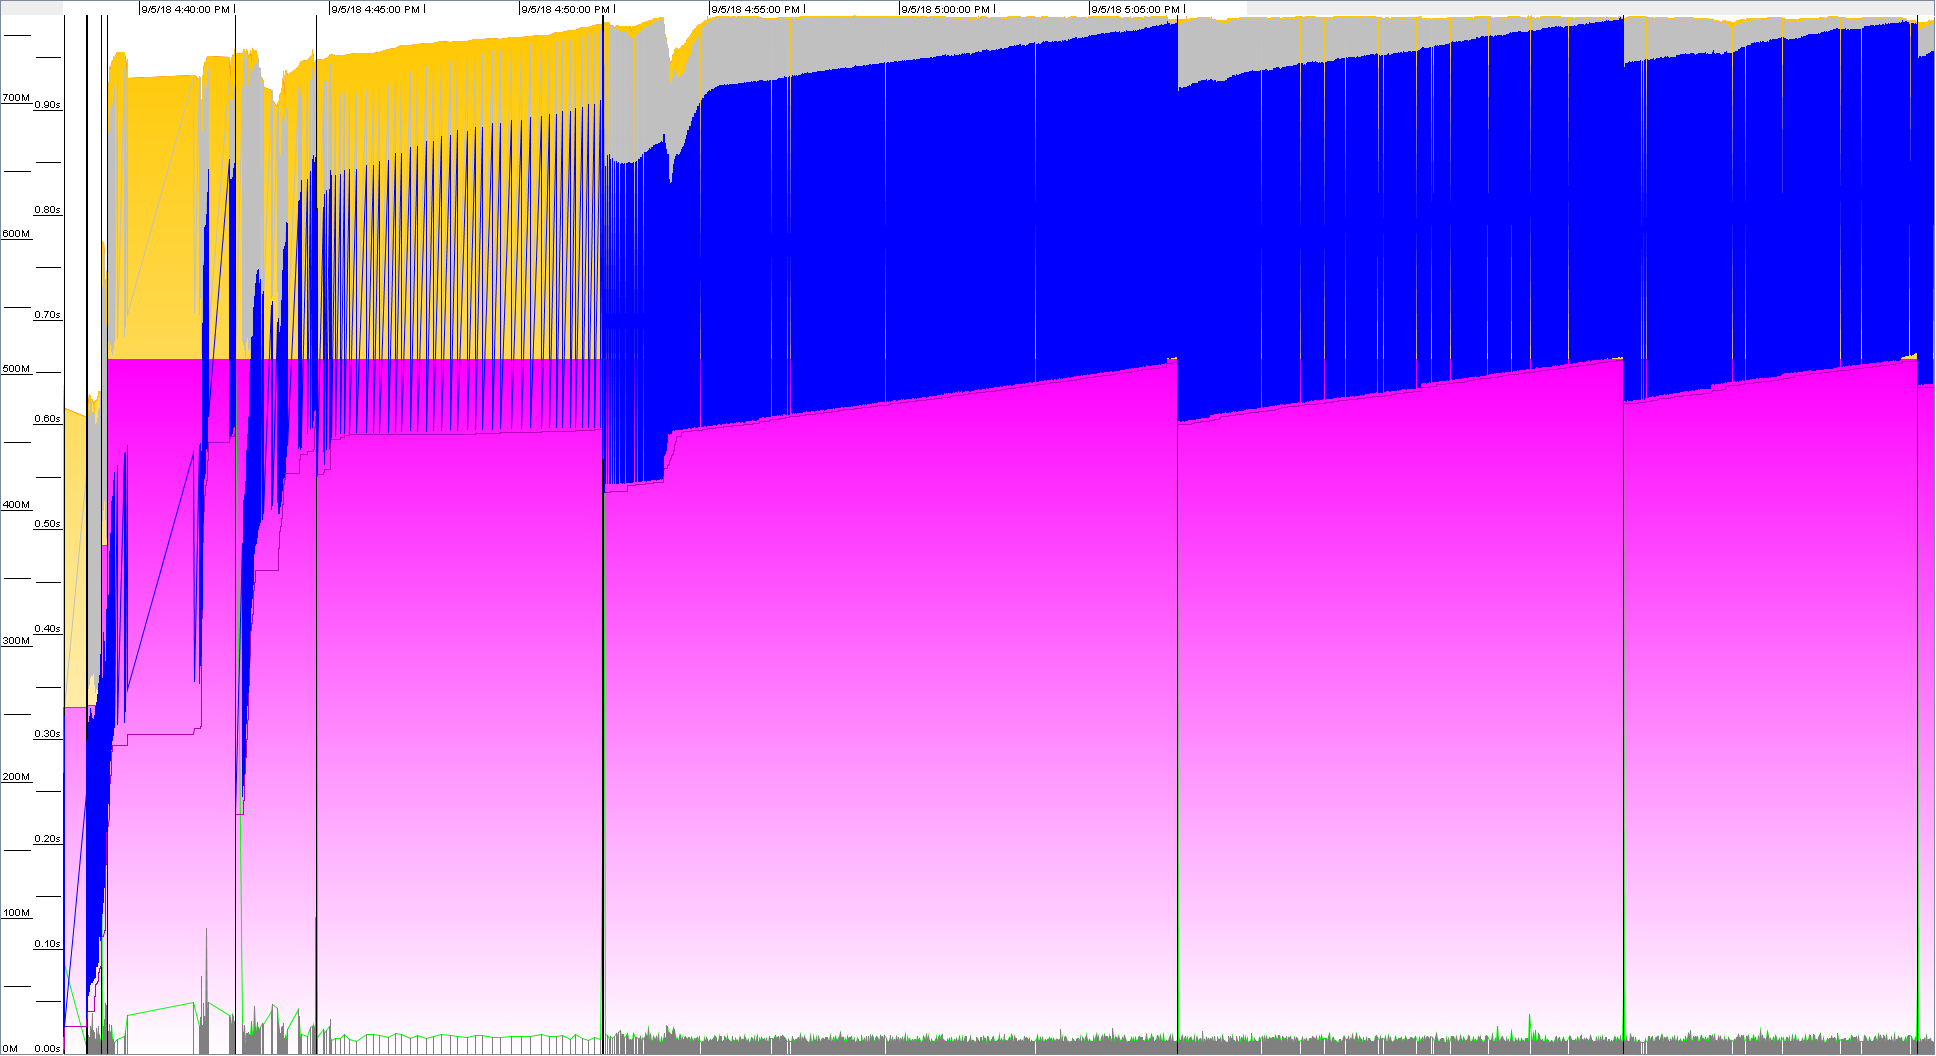
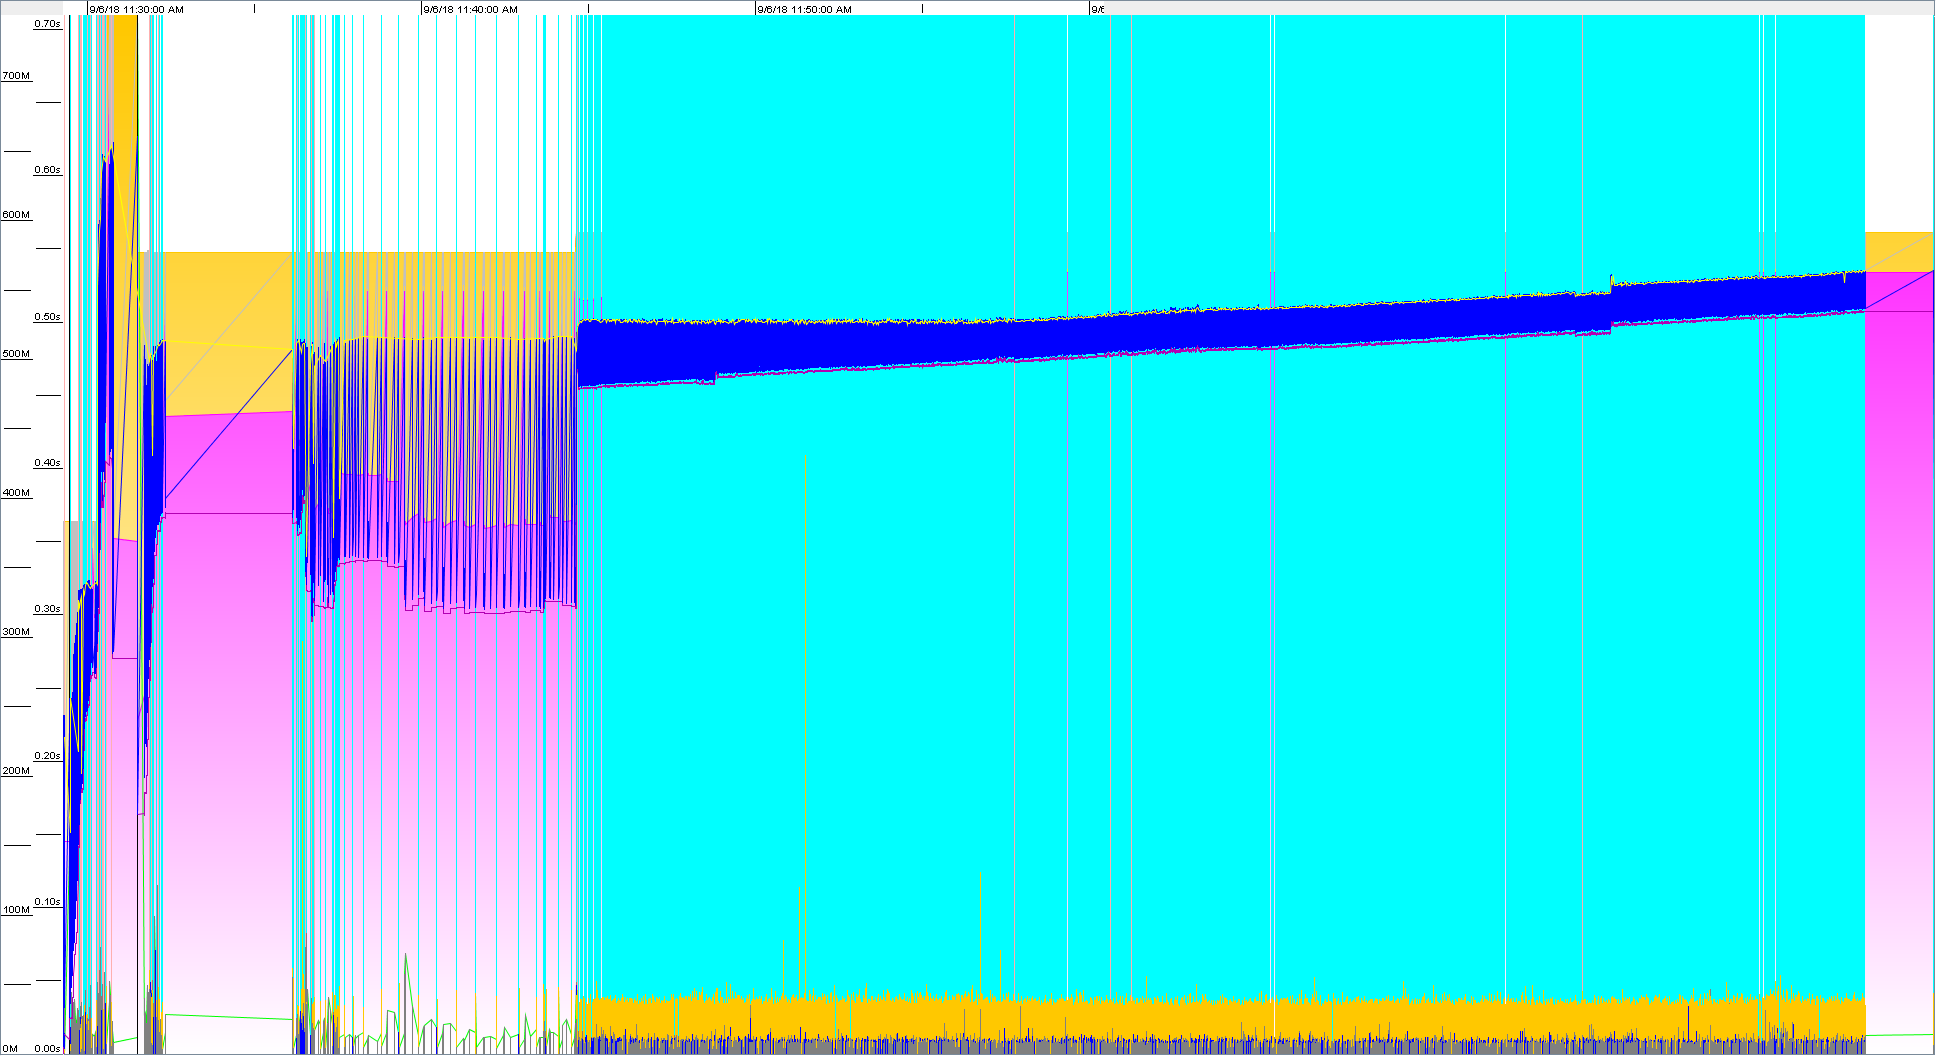
Heap memory is not enough
Xmx = 786M
- The Young - Tenured Generation ratio is about 30% - 70%.
- The memory footprint area is about 30% of the total heap size.
- There are frequent full GC during the high load period. Usually, the CPU spike will be for a short period of time due to frequent full GC, however, the application might hit into OutOfMemoryError Exception.
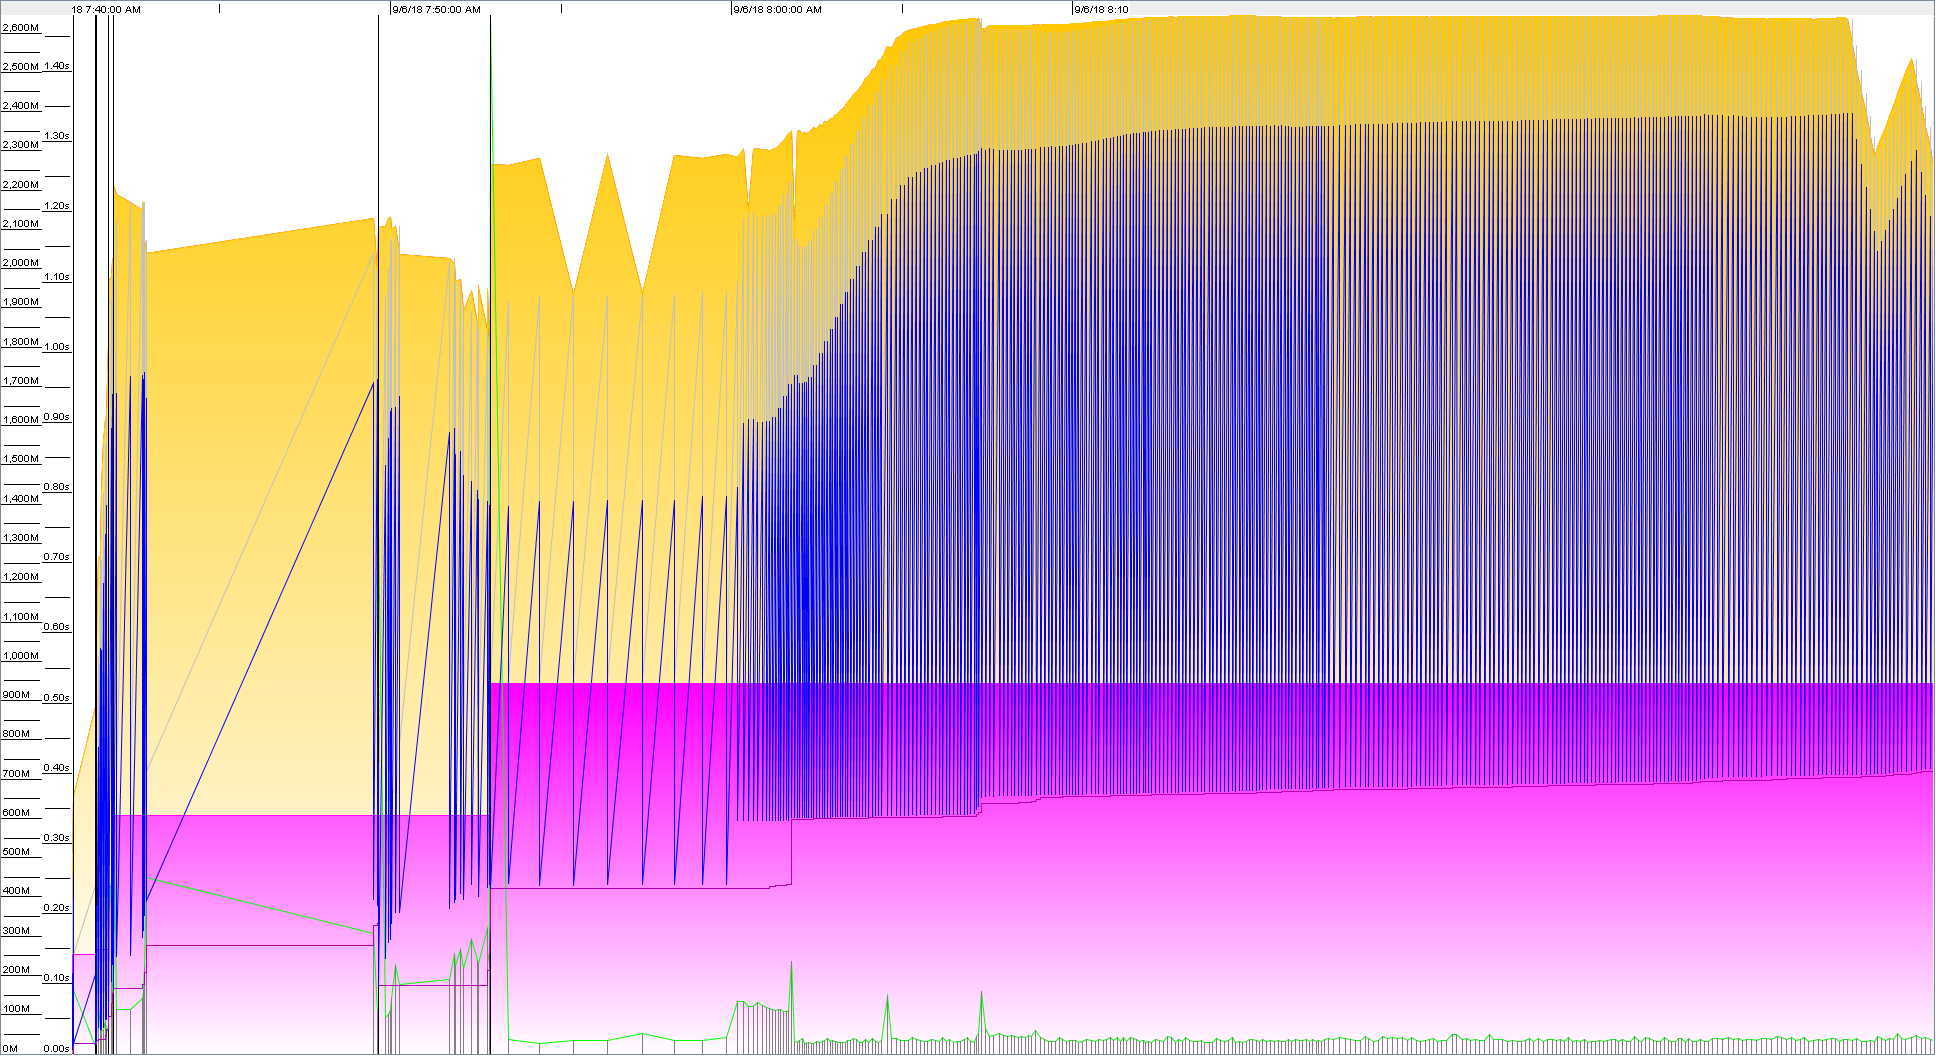
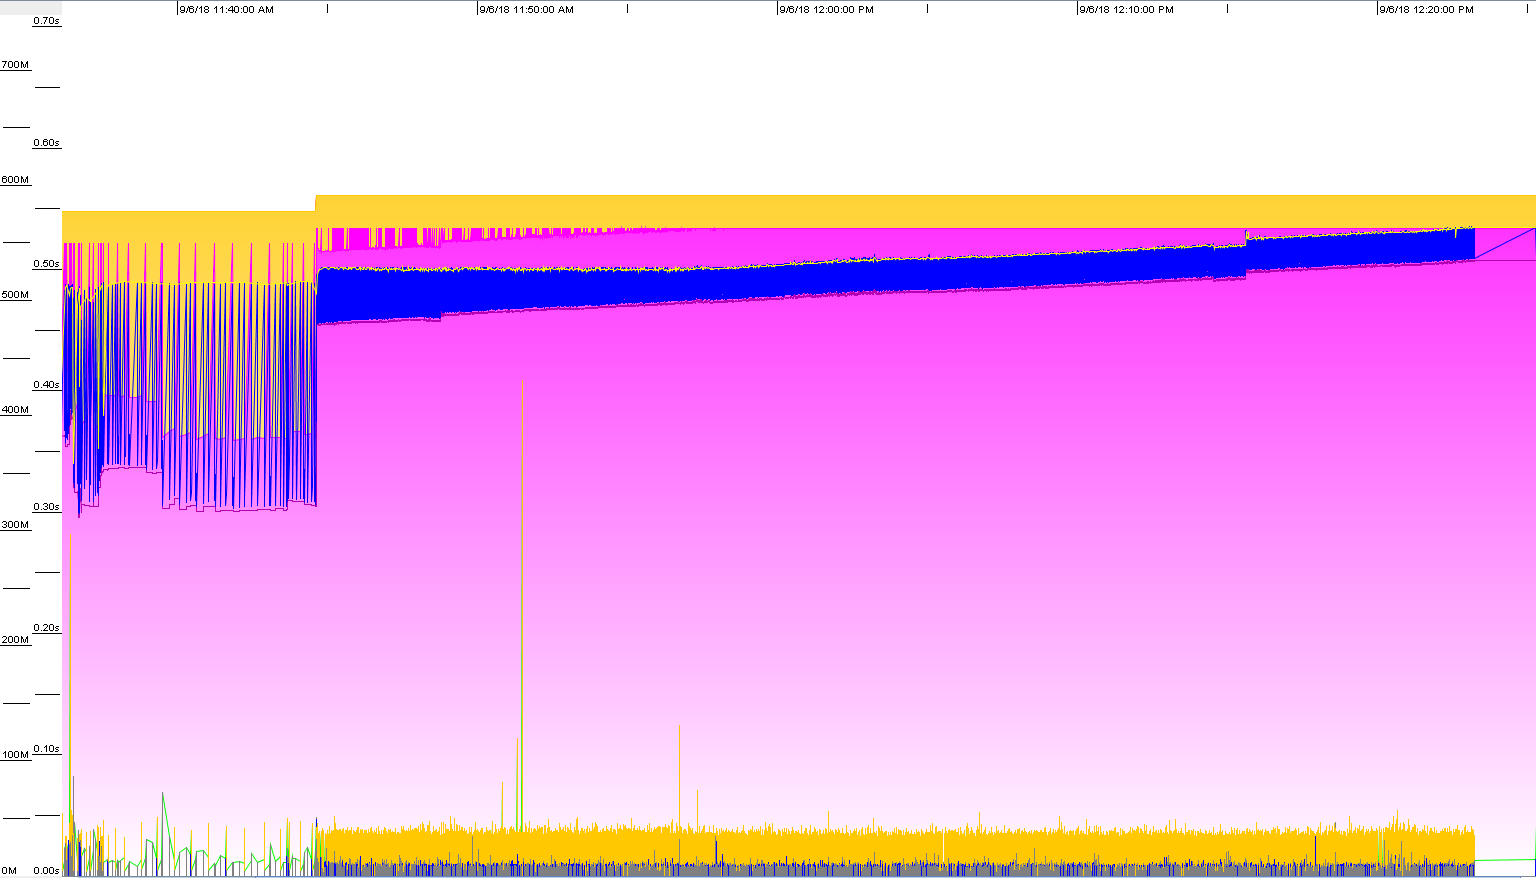
A good heap memory allocation
Xmx = 2048M
- The Young - Tenured Generation ratio is about 50% - 50%.
- The memory footprint area is about 60% of the total heap size.
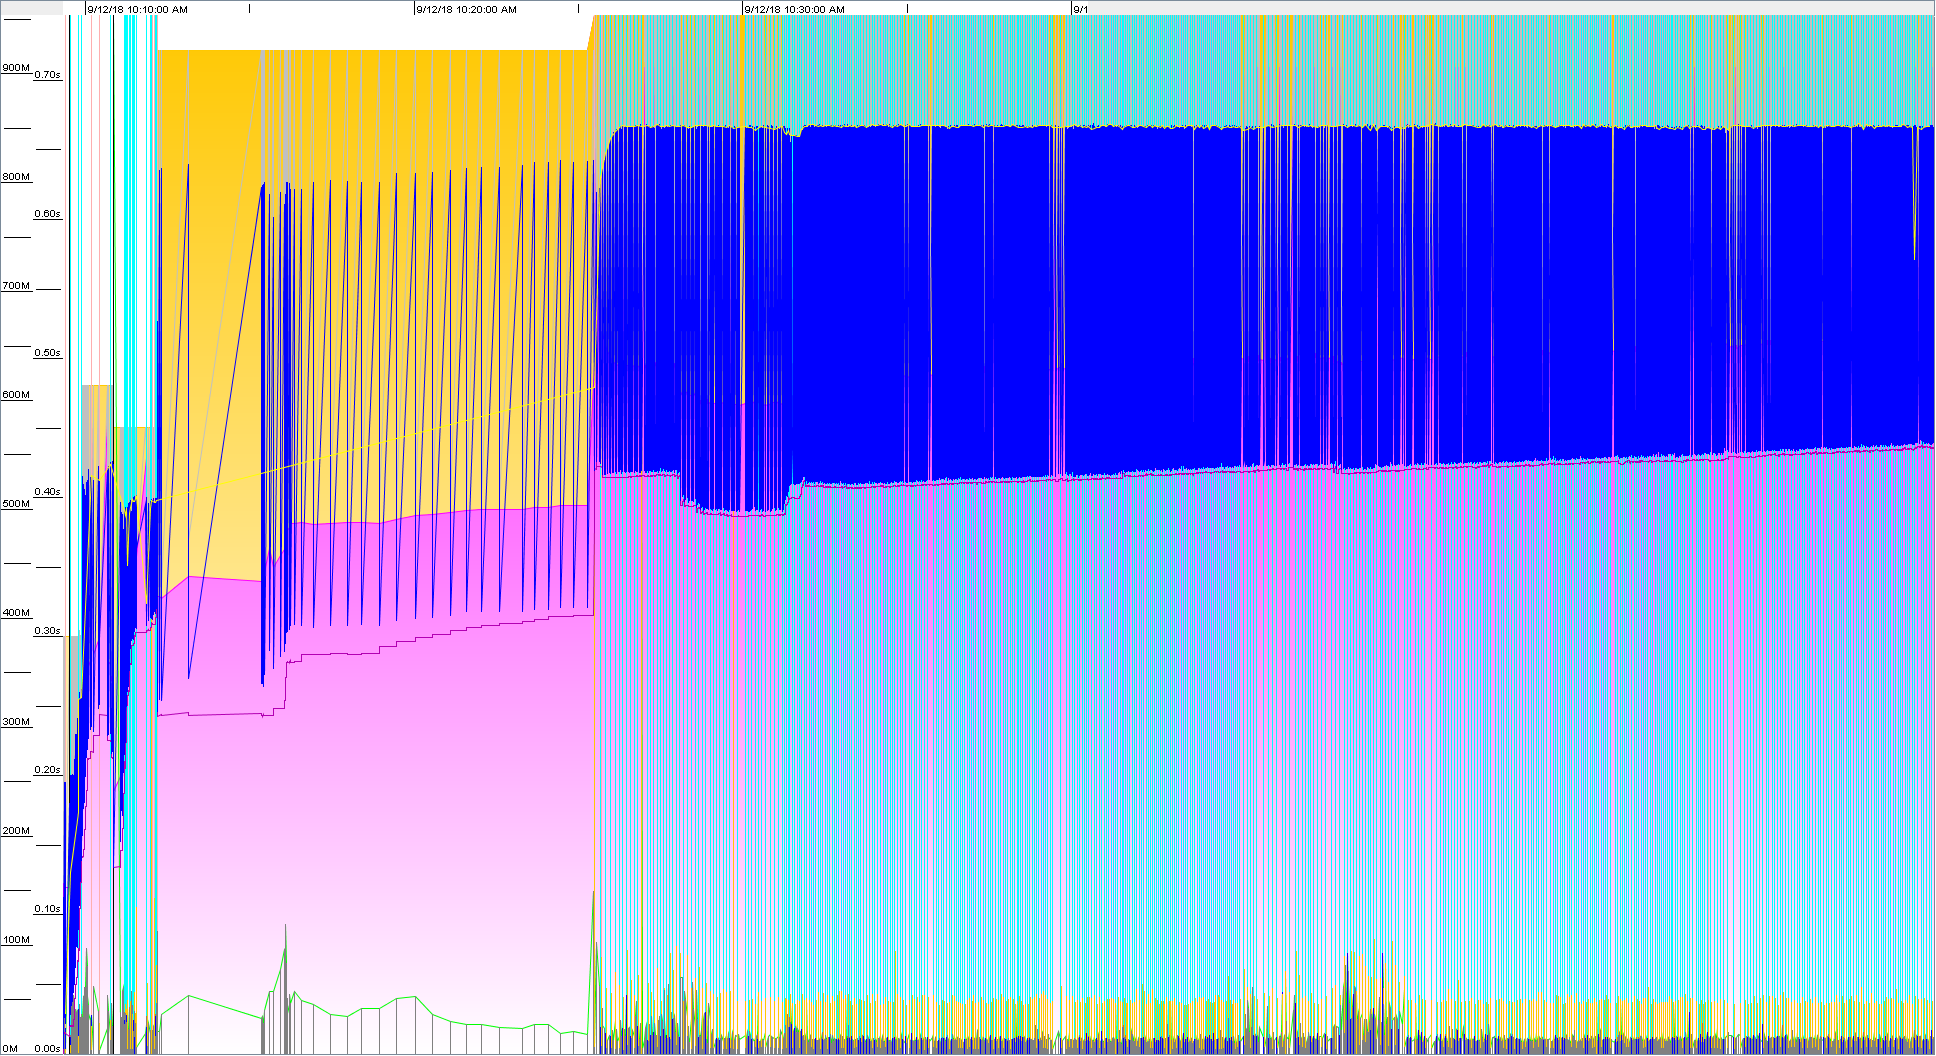
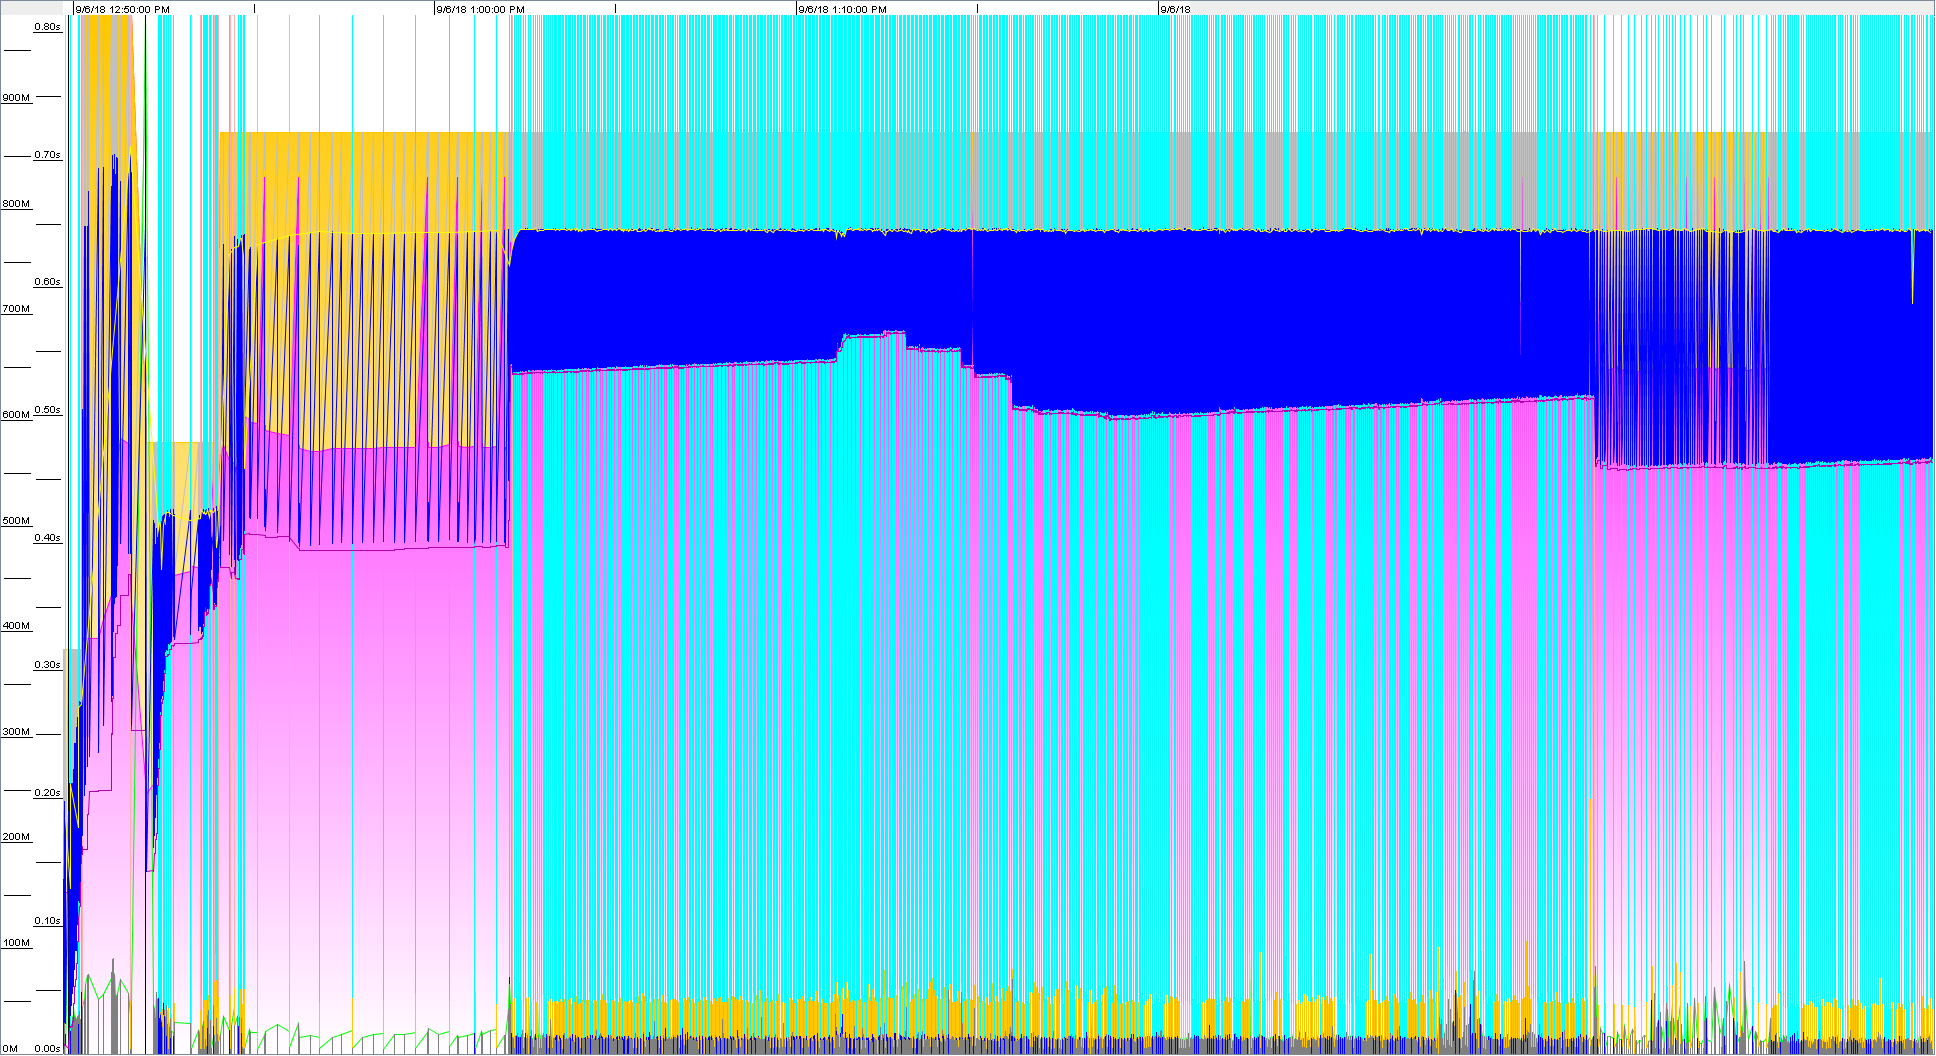
Too much of heap memory
Xmx = 5120M
- The Young - Tenured Generation ratio is about 60% - 40%.
- The memory footprint area is about 60% of the total heap size.
- Here, the trade-off will be - OS needs to use more CPU power to clear 60% of the heap memory for every minor GC and approximately 70% - 80% of the heap memory for every full GC. This is where you will be seeing constant CPU spikes on Jira machine.
G1GC
This GC algorithm is designed to better support heaps larger than 4-6 GB. It uses multiple threads to scan through the heap memory by splitting them into smaller regions (sized between 1MB to 32MB) - G1 collector is designed to scan those regions that contain the most garbage objects first. Due to this, it reduces the chances for having those long full GC pauses (which can take many seconds in a large collection) that occur with large heaps. The downside is that, due to the number of operations performed by this algorithm, it does cause an overhead of about 20% heap / CPU (hence why this algorithm is recommended for larger heaps).
The simulation graphs could be slightly similar due to G1GC is more efficient for larger heap sizes.
An optimum memory allocation
Xmx = 1536M
- The Young - Tenured Generation ratio is about 40% - 60%.
- The memory footprint area is about 40% of the total heap size.
- The Tenured Generation is constantly being cleaned by minor GC.
Heap memory is not enough
Xmx = 786M
- The Young - Tenured Generation ratio is about (less than)20% - 80%.
- The memory footprint area is about less than 10% of the total heap size.
- This is bad and the application might hit into OutOfMemoryError Exception as well.
A good heap memory allocation
Xmx = 2048M
- The Young - Tenured Generation ratio is about 30% - 70%.
- The memory footprint area is about less than 20% of the total heap size.
Too much of heap memory
Xmx = 5120M
- The Young - Tenured Generation ratio is about 70% - 30%.
- The memory footprint area is about more than 50% of the total heap size.
- As we can see, the Tenured Generation keeps growing and the full GC will be very costly.
Full GC problem (GC overhead)
The GC activities will look like the following:
The black bar on the graph indicates that the JVM took too long to free up memory during its GC process. The GC will throw an OutOfMemoryError (OOME) if too much time is being spent in garbage collection: if more than 98% of the total time is spent in garbage collection and less than 2% of the heap is recovered, an OutOfMemoryError will be thrown. This feature is designed to prevent applications from running for an extended period of time while making little or no progress because the heap is too small.
It is often accompanied by high CPU use, as the JVM will be constantly attempting to perform GC, which can require intensive resources. This can lead to the application becoming unresponsive and in worse cases can result in the entire server being unresponsive (this will affect all applications on that server). This will eventually require a restart or the application may recover.
Common myth - too much heap is always better
Providing excessive heap memory for a Java application will cause more harm than improving the performance.
When we use bigger heap with the Parallel GC algorithm, the number of GC pauses are decreased because it takes longer to have the chunk of heap filled with enough objects that a GC operation is called. But at the same time, bigger heap means longer pauses when the GC finally occurs due to how much heap needs to be scanned for objects. So, as you can imagine, increasing the heap to a ridiculous size is not a solution.
- Longer pause time for full GC - which means the application will be in a paused state for seconds or minutes in case of a very large heap size. This is where we see the application hangs for a period and usually, a restart would fix the problem.
- More heap memory will always trade-off the machine's CPU power when Java triggers the full GC.
- GC tuning is about finding a balance between the size of the entire heap and the sizes of the Young to the Old Generation, which is why more heap is not always a good thing.

