In-product diagnostics administration and support
In-product diagnostics (IPD) is a tool embedded into Atlassian’s Data Center products: Jira, Confluence, and Bitbucket. IPD collects performance statistics, performs basic monitoring and simple performance testing, and delivers proactive alerts related to the customer environment. The output can be consumed by Atlassian support engineers as well as your Jira admins (and third-party tools) to monitor and analyze instance behavior.
On this page:
The problem
Have you ever struggled with understanding whether your Jira instance is healthy or not? We hear the same struggle when talking to our admins. Be it for Jira, Confluence, or Bibucket Data Center.
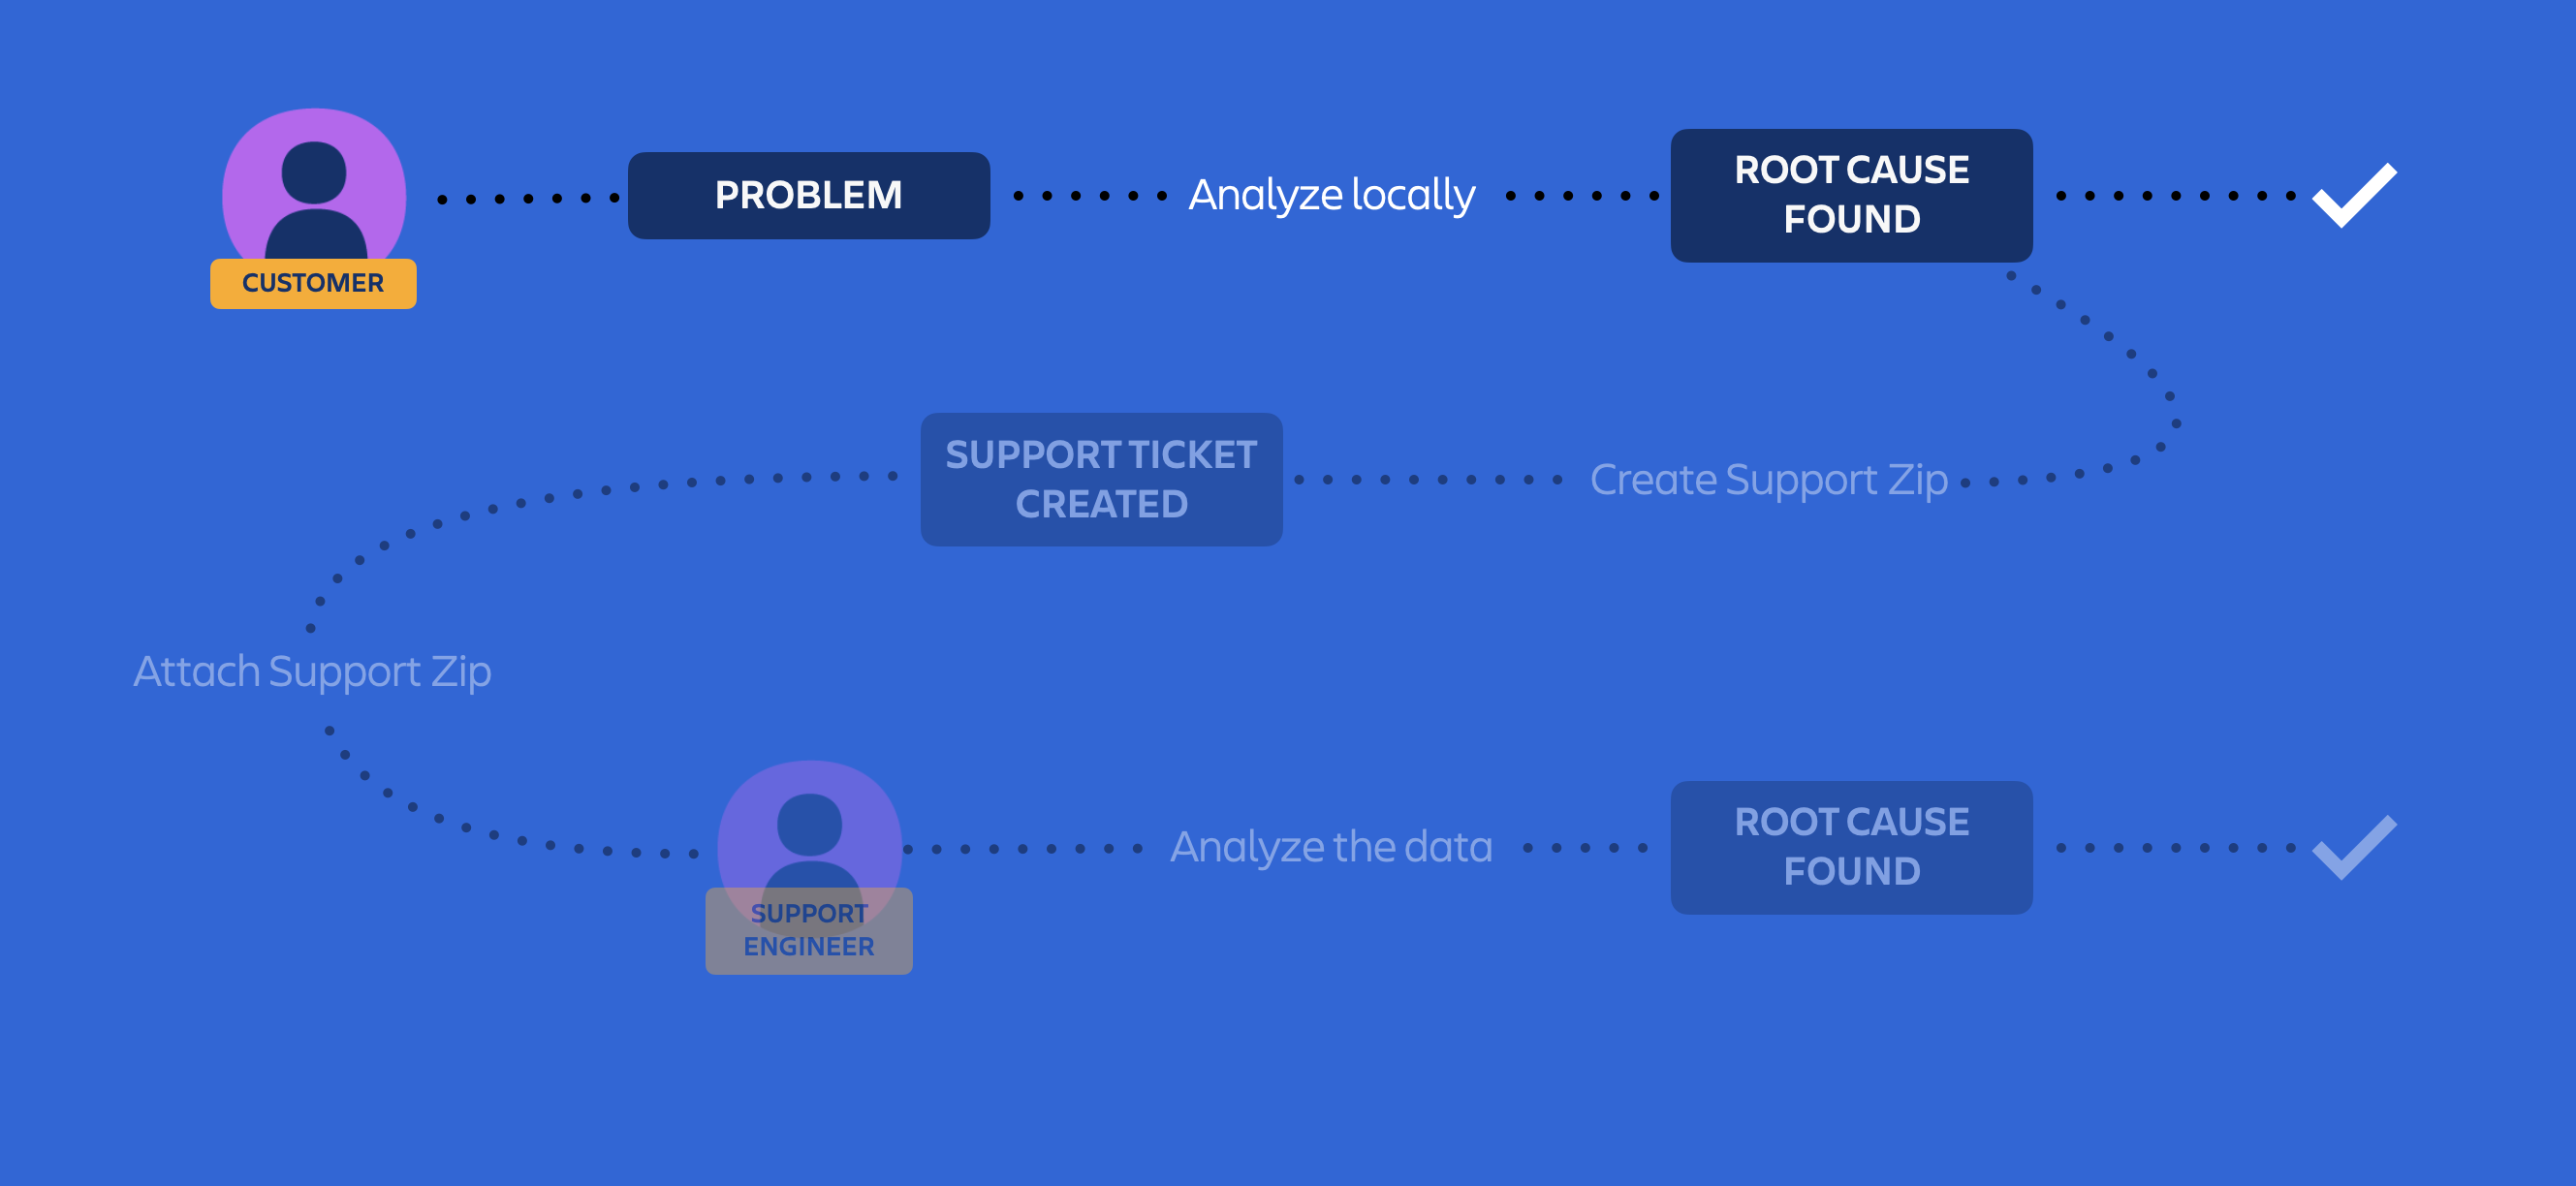
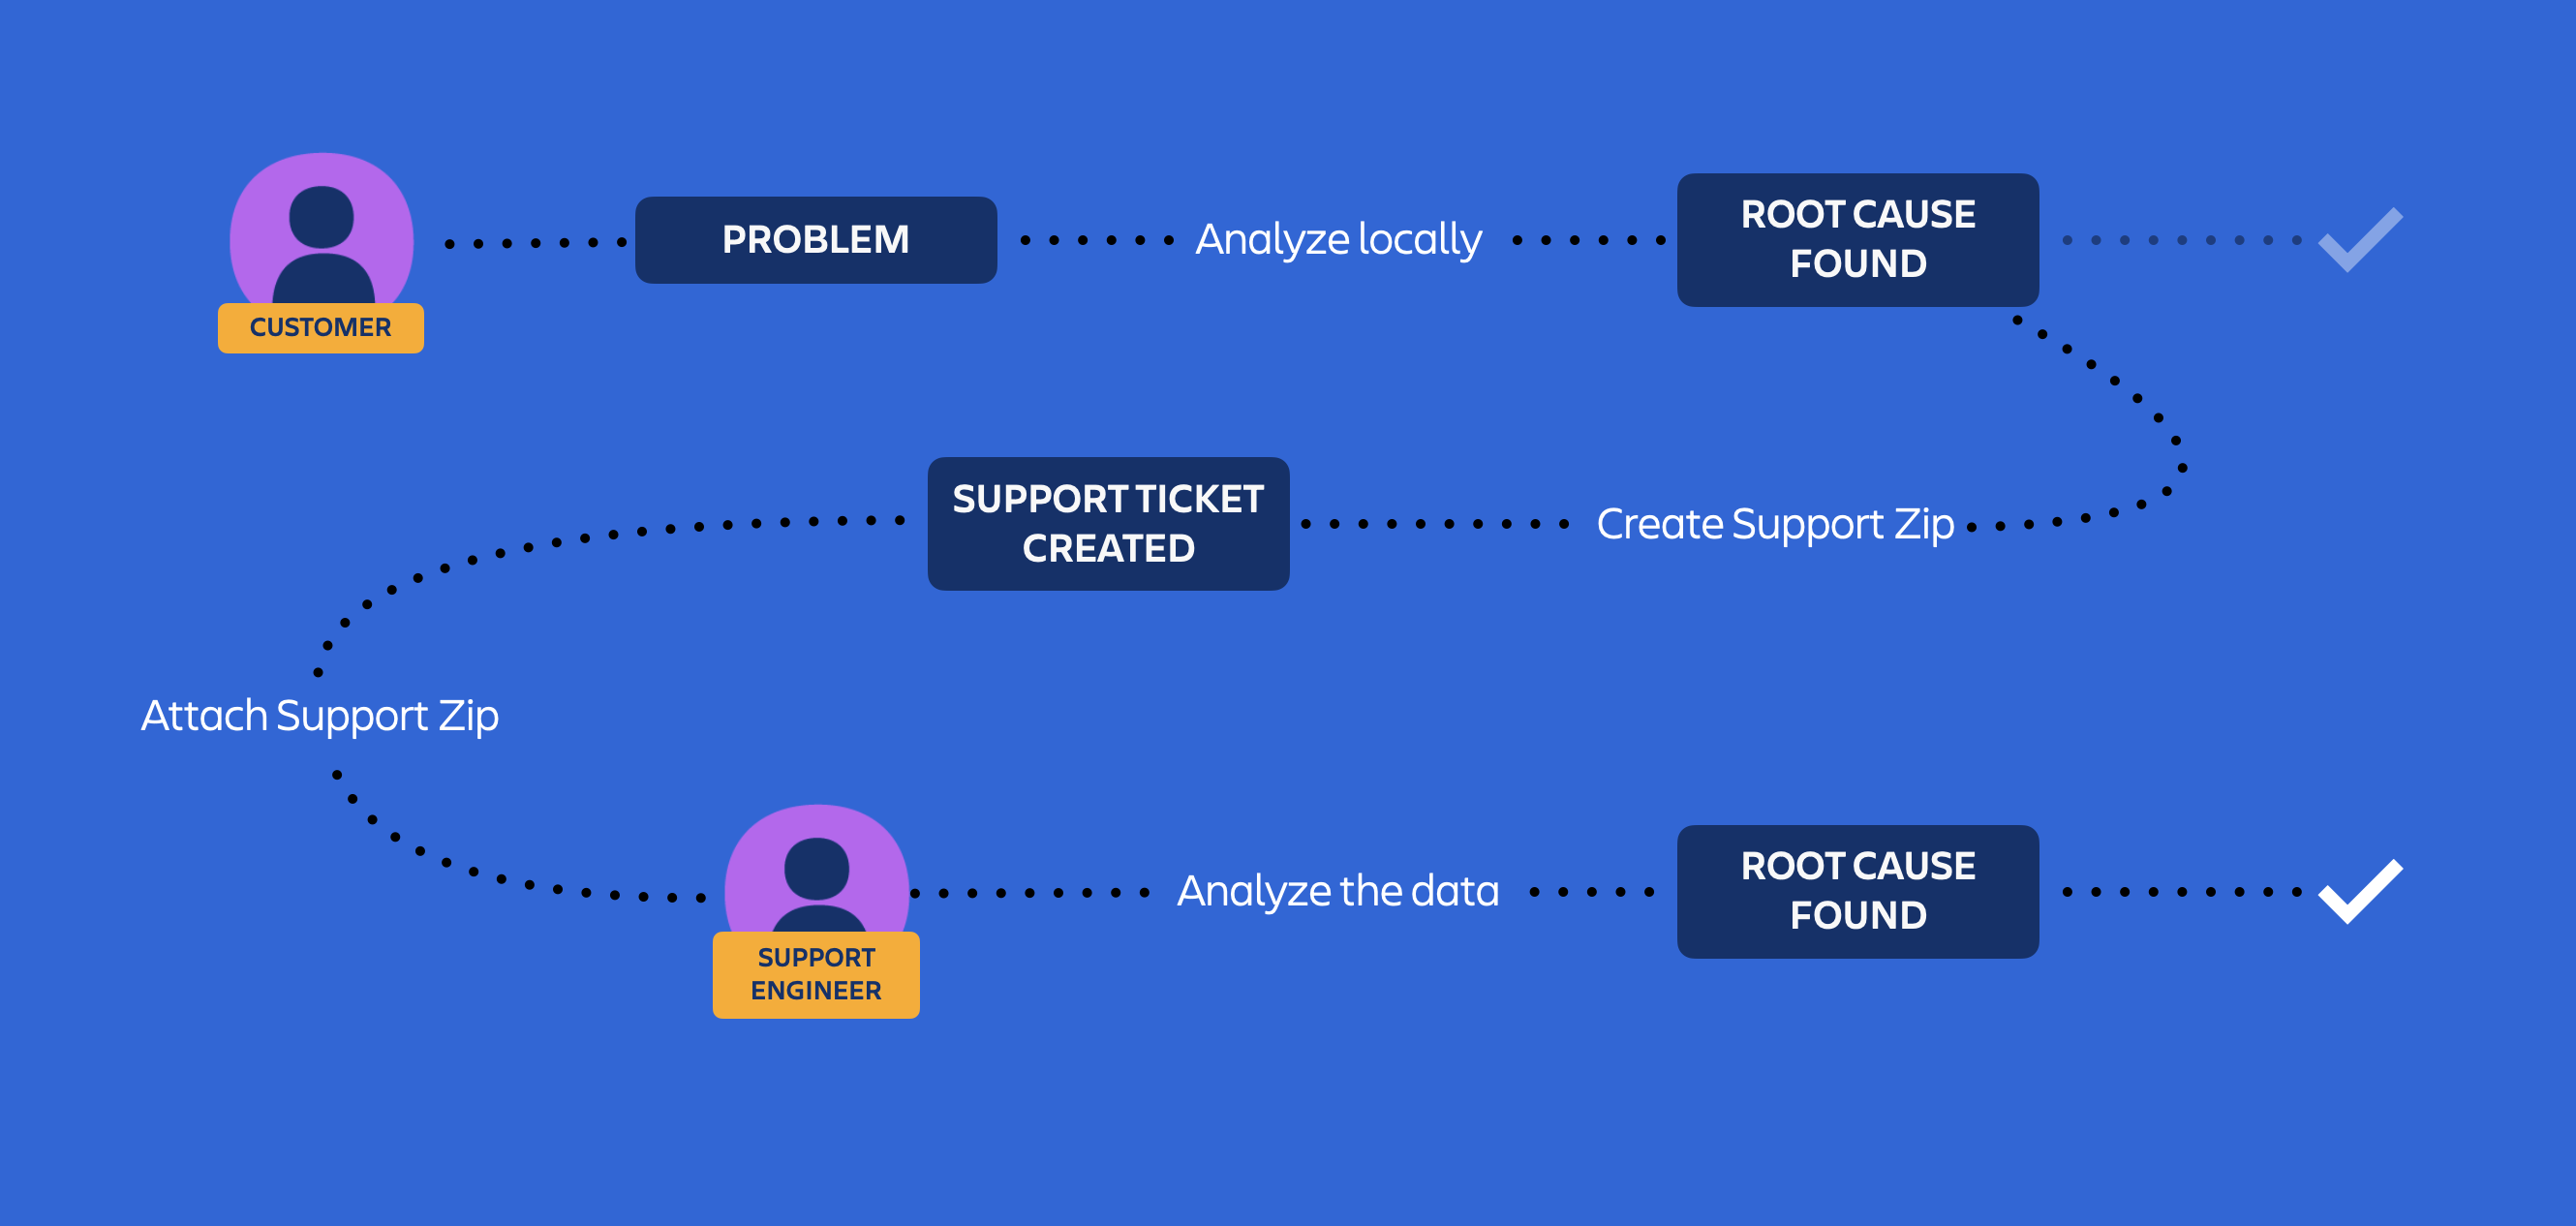
Our admins and support teams often find themselves struggling to capture the right data at the right time. That delays any investigation our support teams are trying to undertake to get to the root cause of the issue.
The solution
We built In-product diagnostics from the ground up and shipped it by default with our Jira, Confluence, and Bibucket Data Center. We also made it extremely easy for admins to relay that information to our support teams. Every support zip generated includes such information by default.
Benefits for admins
Enabled by default and always running
Ability to monitor the system's health status
Identify and potentially solve issues within their system
Benefits for Atlassian customer support
Automatically add diagnostics data in the support zip
Achieve quicker resolution times and conduct root cause analyses more efficiently
Reduce back-and-forth communication between your admins and Atlassian support teams
The tools we built are focused on two aspects:
Performance: we used a powerful tool built by Oracle which has become an industry standard – Java Flight Recorder (JFR). We ship it by default and made its configuration an easy and seamless experience.
Health monitor: we chose the most common and useful set of health monitor metrics to instrument within our products. This was based on feedback from both Atlassian customers and support teams.
The following screenshots show what this data will look like if you load it into your internal visualization tool. All the health monitor metrics are available through JMX.
Enable Java Flight Recorder
In Jira, Confluence, and Bitbucket, Java Flight Recorder is enabled by default. To find the setting, go to Administration, select System, and go to Troubleshooting and support tools.
Find out more about JFR in Health check: Java Flight Recorder (JFR).
Visualize JMX (Database stats)
Cross-product metrics for JMX monitoring and in-product diagnostic are used across Data Center products: Jira, Confluence, and Bitbucket.
Live metrics are available in the following formats:
as new JMX MBeans
as a history of snapshots of the JMX values in the new IPD log file
atlassian-jira-ipd-monitoring.log
The log file is available in the {jira_home}\log folder where you can find all the existing log files.
Screenshot: Check a database connection pool
Screenshot: Check database latency
Find out more about in-product diagnostics metrics in Interpreting cross-product metrics for in-product diagnostics.
Visualize JMX (Internode stats)
We added several metrics for monitoring the health and performance of your instance infrastructure:
Internode connected status
Internode latency
Find out more about in-product diagnostics metrics in Interpreting cross-product metrics for in-product diagnostics.
Product-specific details
Check out the product-specific information on in-product diagnostics in Jira, Confluence, and Bitbucket Data Center.
| Jira | Confluence | Bitbucket | |
|---|---|---|---|
| Availability |
|
|
|
| Highlights |
|
|
|
| Documentation |


