Jira Service Management 5.12.x Long Term Support release performance report
We are continuing to evolve and improve the quality of our performance reports. For this LTS performance report, we extensively tested the performance of Jira Service Management Data Center using significantly larger datasets and virtual loads generated by a cohort of heavy virtual users. We also broadened the scope to include common actions and analyzed data that reflects real-world usage profiles of Jira Service Management, Service-management heavy and Assets-heavy usage profiles. We hope these enhancements provide richer insights and give you a better understanding of how Jira Service Management 5.12 is performing.
On this page:
About Long Term Support releases
We recommend upgrading Jira Service Management regularly, but if your organization's process means you only upgrade about once a year, upgrading to a Long Term Support release is a good option. It provides continued access to critical security, stability, data integrity and performance issues until this version reaches end of life.
Summary
The report below compares the performance of versions 5.12 and 5.4. You may notice that version 5.12 shows slower metrics. We’ve added many new features to Jira Service Management since version 5.4. As a result, the perceived performance remains comparable, making these slight regressions an acceptable trade-off.
As seen from our past roadmap, we’ve shipped more features that support the Service-heavy usage profile. This is reflected in performance improvements skewed towards the Assets-heavy usage profile. The perceived performance for both profiles is similar, and you can be assured that Assets can be adopted at scale without any detrimental impact on the overall system health.
Testing methodology
The following sections detail the testing methodology, usage profiles, and testing environment we used in our performance tests.
How we tested
Before we started testing, we needed to determine what size and shape of dataset represents a typical large Jira Service Management instance. To achieve that, we used data that closely matches the instance and traffic profiles of Jira Service Management in a large organization.
The following table represents the baseline dataset we used in our tests, which is equivalent to an XLarge size dataset.
| Data | Value |
|---|---|
| Admin | 1 |
| Agents | 4,101 |
| Attachments | 3,042,311 |
| Comments | 8,021,419 |
| Components | 15,774 |
| Custom fields | 344 |
| Customers | 200,000 |
| Groups | 1006 |
| Issue types | 13 |
| Issues | 4,969,548 |
| Jira users only | 100 |
| Priorities | 7 |
| Projects | 3,447 |
| Resolutions | 9 |
| Screen schemas | 7,048 |
| Screens | 42,862 |
| Statuses | 41 |
| All users (including customers) | 204,201 |
| Versions | 0 |
| Workflows | 10,044 |
| Object attributes | 500 |
| Objects | 2,018,788 |
| Object schemas | 301 |
| Object types | 6,182 |
Jira Service Management profiles
In this report, we conducted tests on two different profiles: Service-management heavy and Asset-management heavy. These profiles represent two common profiles we’ve observed and aim to provide the reader with a clearer understanding of performance when adopting Assets.
Refer to the table below for more information on these profiles:
| Profile | Description |
|---|---|
| Service-management heavy | This profile represents a usage scenario where the platform is primarily used for managing services, support requests, and IT service management (ITSM) operations. It's a way to assess the platform's performance under conditions of high demand for service-related activities and helps organizations understand how well JSM can support their service management needs, particularly in service desk-intensive situations. The following actions are common:
Large volume of Assets object creation is a less common action in this profile. |
| Asset-management heavy | In this profile, the platform is heavily utilized for asset management tasks, such as asset tracking, inventory management, equipment maintenance, and resource allocation. It assesses how well Jira Service Management can handle the demands of effectively managing and maintaining assets within an organization, making it an important consideration for IT asset management and resource optimization. The following actions are common:
Large volume of request creation and customer portal activity are less common action in this profile. |
Actions performed
We conducted tests with a mix of actions that would represent a sample of the most common user actions for Jira Service Management, like creating requests through the customer portal, viewing agent queues, and commenting on tickets. An action in this context is a complete user operation, like opening a page in the browser window. The number of actions performed varies for each of the two mentioned profiles.
The following table details the actions we tested for our testing profiles and indicates how many times each action is repeated during a single test run.
Action | Description | Number of times an action is performed in a single test run (approximately) | |
|---|---|---|---|
Service-management heavy profile | Assets-heavy profile | ||
Add request participant | Add participant to an existing request | 939 | 85 |
Associate object to request | Associate assets object to a request custom field | 56 | 1368 |
Create new object | Create a new assets object | 56 | 1369 |
Create objects via schema view | Create assets object using endpoints used in schema view | 53 | 509 |
Create private comment for single issue | Create private comment for single issue | 1057 | 85 |
Create public comment for single issue | Create public comment for single issue | 1056 | 85 |
Create request | Create request | 2720 | 1362 |
Delete object | Delete assets object | 56 | 1367 |
Disassociate object from request | Disassociate an assets object from a request custom field | 56 | 1368 |
Navigate to a portal on the Customer Portal | Navigate to a portal on the Customer Portal | 254 | 84 |
Search for customer | Search for customer on the Customers page | 85 | 85 |
Search for a portal on the Customer Portal | Search for a portal on the Customer Portal | 257 | 85 |
Share request with a customer on the portal | Share request with a customer on the portal | 851 | 85 |
Update new object | Update a newly created assets object | 56 | 1368 |
Update request with asset | Add assets object to an existing request | 53 | 509 |
View created object | View an assets object | 56 | 1369 |
View created vs resolved report | View created vs resolved report | 128 | 128 |
View issue in customer portal | View issue in customer portal | 938 | 854 |
View issue on agent view | View issue on agent view | 426 | 512 |
View object overview | View object overview | 85 | 1550 |
View portal landing page | View portal landing page | 257 | 87 |
View queues | View queues | 511 | 170 |
View request via public API | View request via public API | 853 | 678 |
View satisfaction report | View satisfaction report | 128 | 128 |
View time to resolution report | View time to resolution report | 128 | 128 |
View workload report | View workload report | 128 | 128 |
openGraph | Open assets graph view (browser test) | 380 | 160 |
openLandingPage | Open portal landing page (browser test) | 380 | 160 |
openRequestOnIssueView | Open request on issue view (browser test) | 380 | 160 |
openRequestOnPortal | Open request on customer portal (browser test) | 380 | 160 |
viewMyRequestsOnPortal | View My requests on customer portal (browser test) | 380 | 160 |
viewProjectSettingsPage | View project settings page (browser test) | 380 | 160 |
Test environment
The performance tests were all run on a set of AWS EC2 instances. For each test, the entire environment was reset and rebuilt, and then each test started with some idle cycles to warm up instance caches. Below, you can check the details of the environments used for Jira Service Management Data Center, as well as the specifications of the EC2 instances.
Our tests are a mixture of browser testing and REST API call tests. Each test was scripted to perform actions from the list of scenarios above.
Each test was run for 40 minutes, after which statistics were collected.
The test environment used the hardware below, which aligns with the recommended X-Large Jira instance. Learn more about Data Center infrastructure recommendations
- 5 Jira nodes
- Database on a separate node
- Load generator on a separate environment
- Shared home directory on a separate node
- Load balancer (AWS ELB HTTP load balancer)
Jira Service Management Data Center
| Hardware | Software | ||
| EC2 type: | c5.4xlarge 5 nodes | Operating system | Ubuntu 20.04.6 LTS |
| CPU | Intel Xeon E5-2686 v4 or Intel Xeon Haswell E5-2676 v3 | Java platform | Java 11.0.18 |
| CPU cores: | 16 | Java options | 24GB heap |
| Memory: | 32 GB | ||
| Disk: | AWS EBS 2TB gp2 | ||
Database
| Hardware | Software | ||
| EC2 type: | db.m4.4xlarge | Database: | Postgres 12 |
| CPU: | Intel Xeon Platinum 8000 series (Skylake-SP) | Operating system: | Ubuntu 20.04.6 LTS |
| CPU cores: | 16 | ||
| Memory: | 64 GB | ||
| Disk: | AWS EBS 2TB gp2 | ||
Load generator
| Hardware | Software | ||
| CPU cores: | 2 | Browser: | Headless Chrome |
| Automation script: | Jmeter Selenium WebDriver | ||
| Memory: | 8 GB | ||
Performance summary for Service-management heavy profile
Constant load test
For this test, a constant load was applied for 40 minutes and the median response time observed.
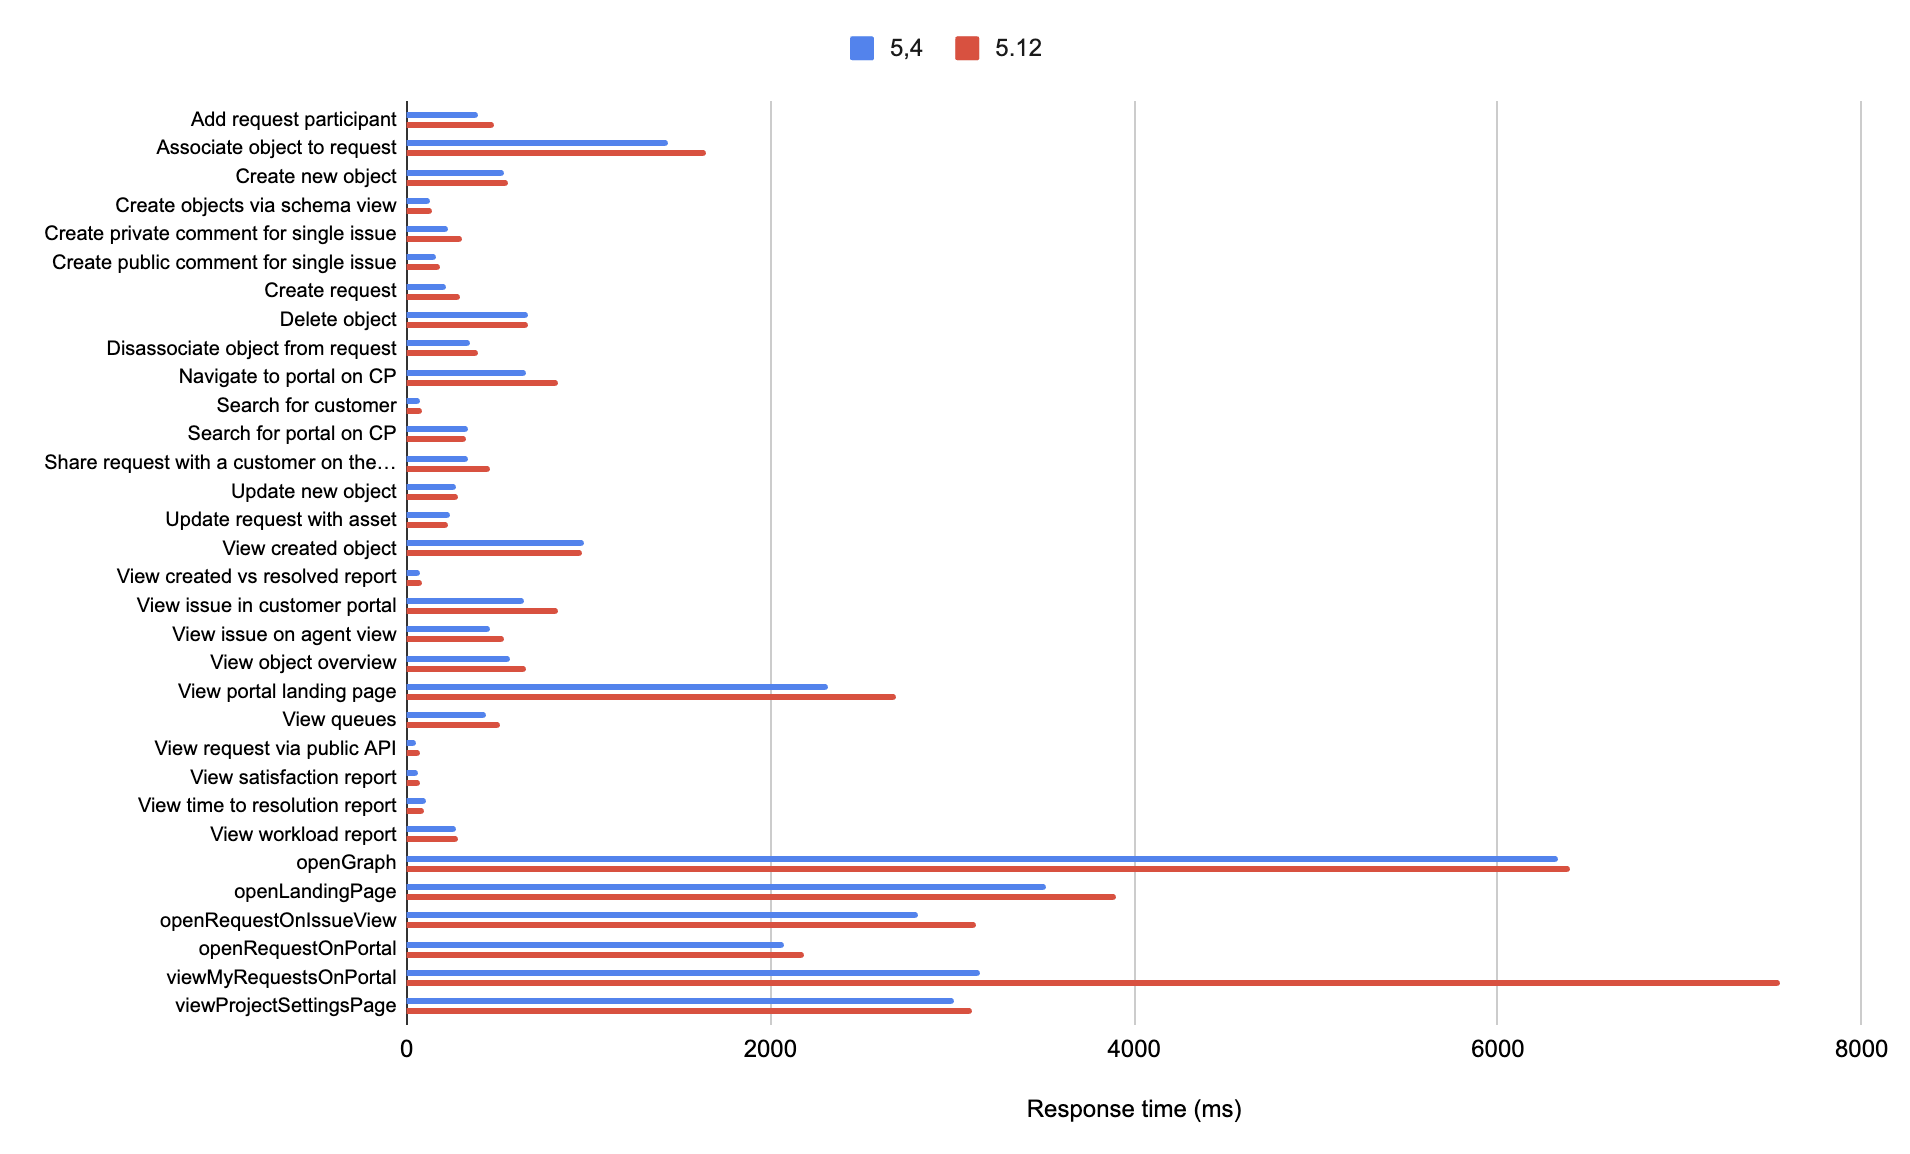
The graph below shows the differences in response times of individual actions between 5.12 and 5.4.10. The data used to build the graph is below.
The regressions we see in the above graph can be attributed to:
- the functional improvements introduced in the product from 5.4 to 5.12, which provide significant feature values.
- the changes related to A11y improvements, as we have been actively addressing critical A11y issues following our recent VPAT assessment update. Particularly the viewMyRequestsOnPortal action, that we are aiming to resolve in the upcoming 5.12 bugfix release.
Increasing load test
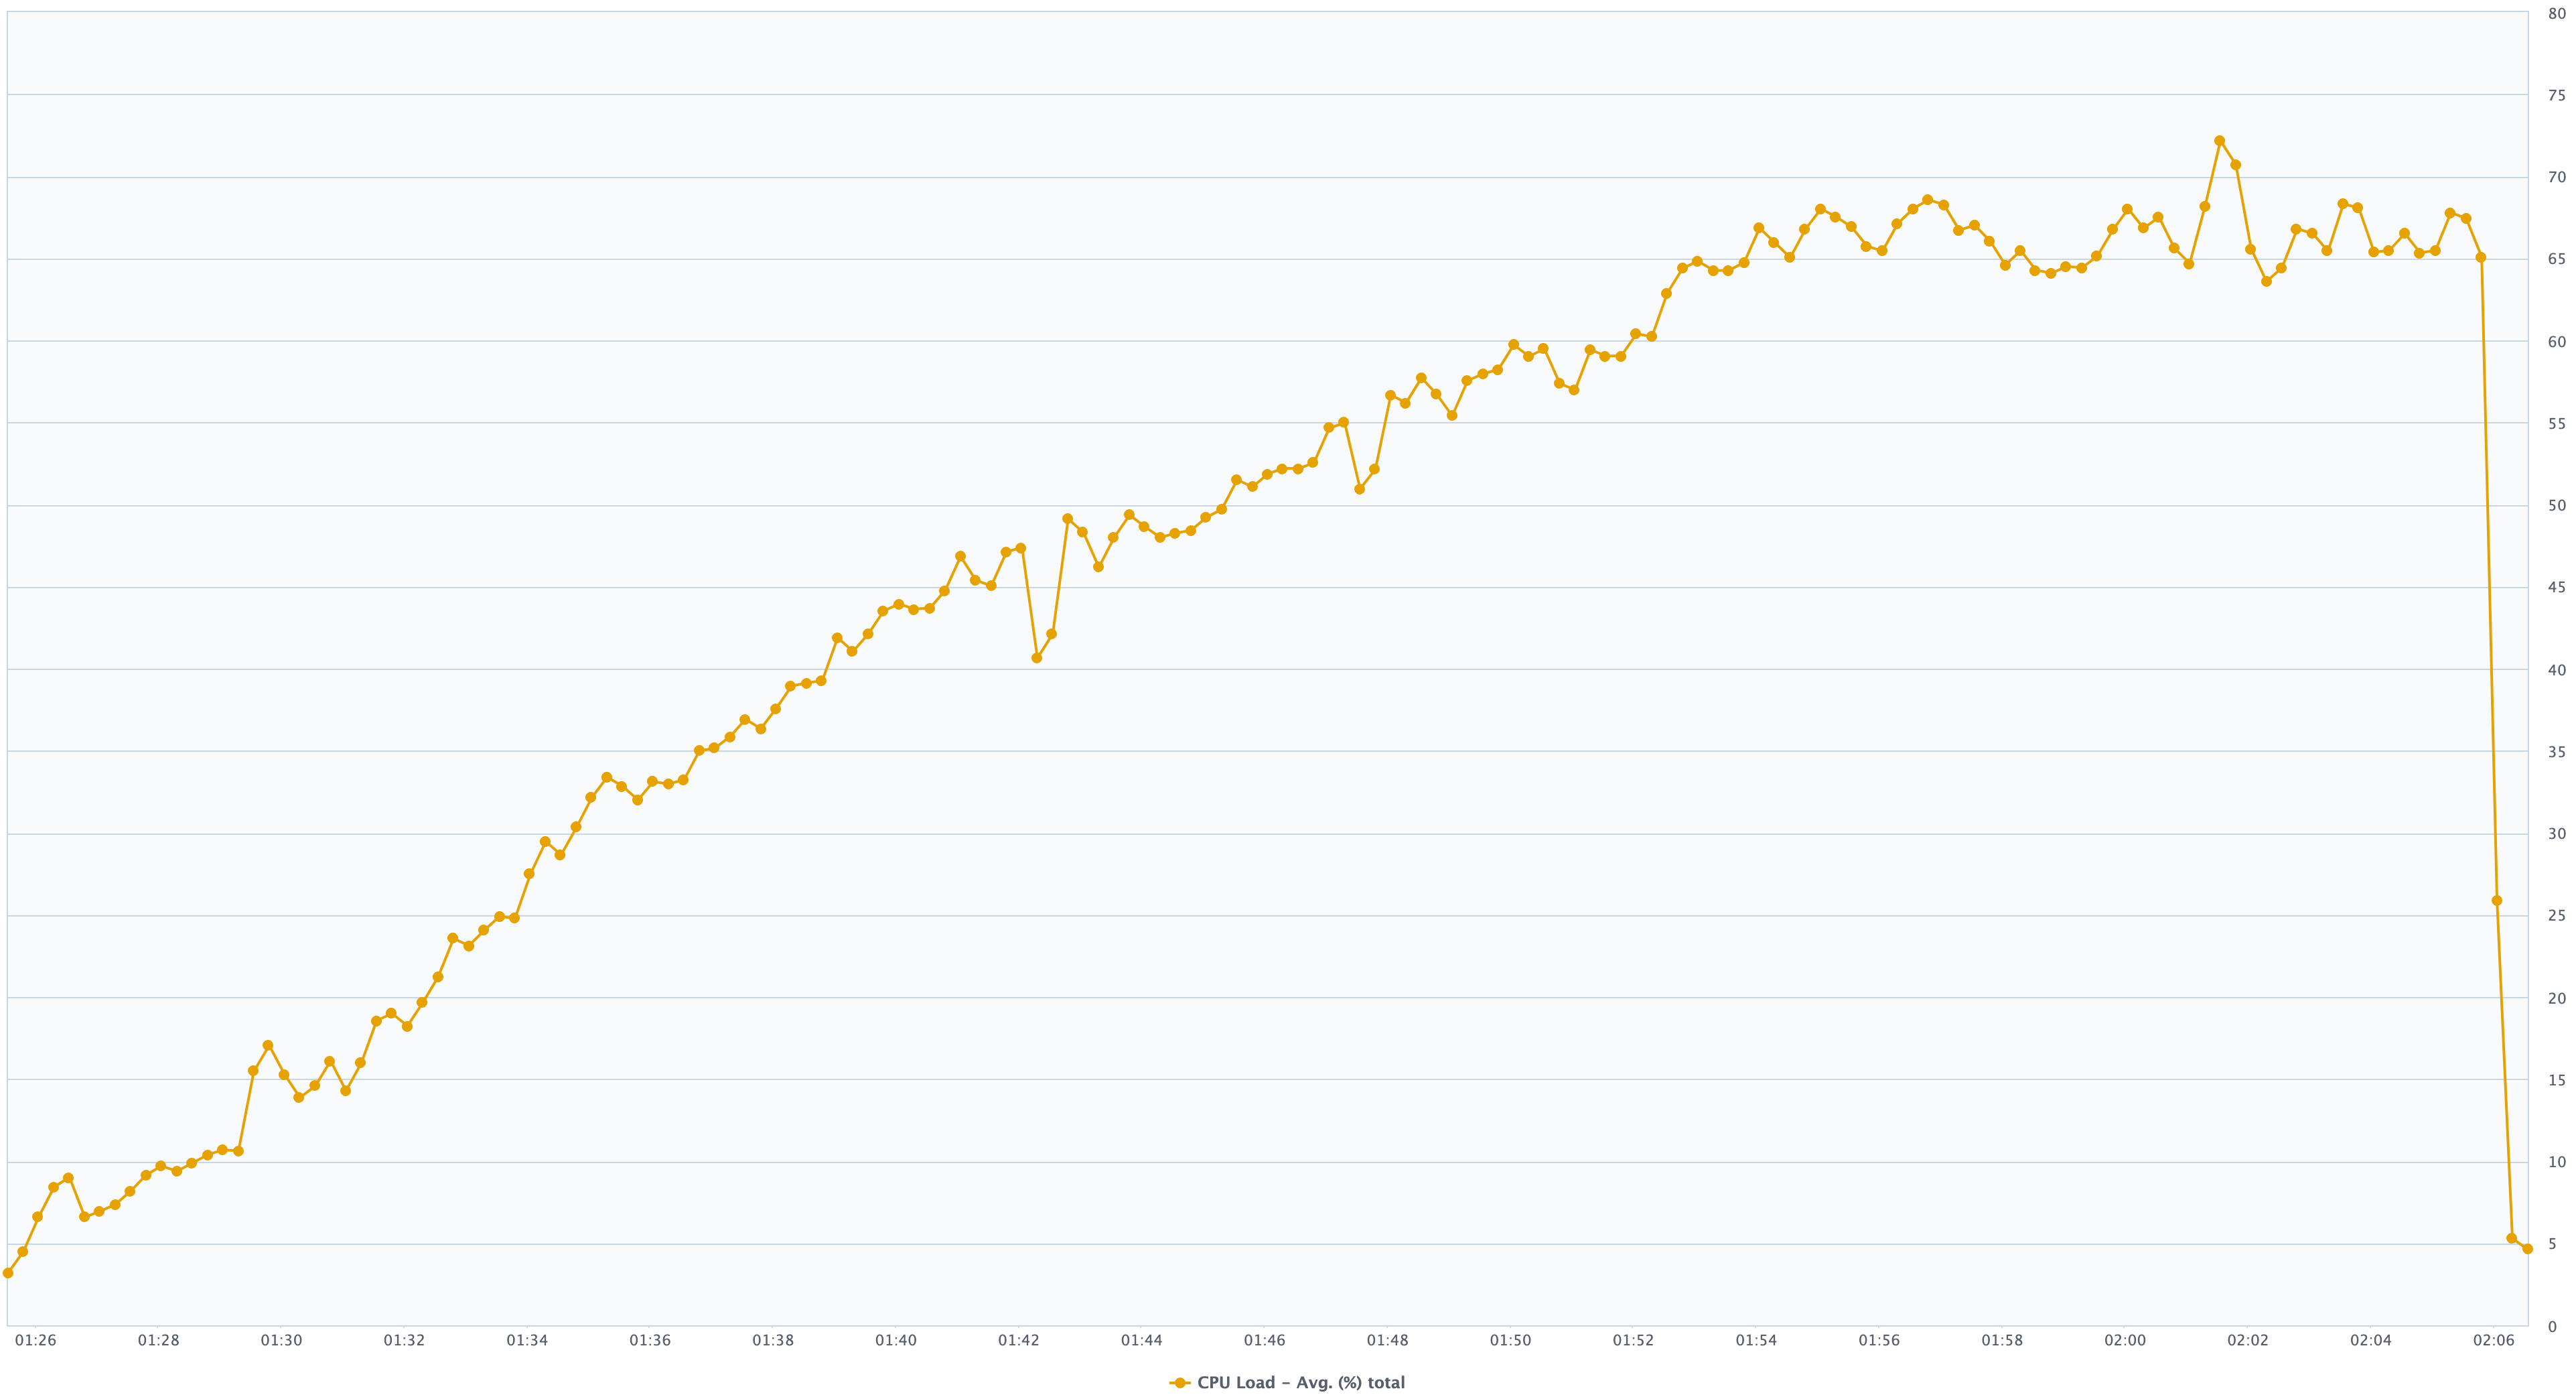
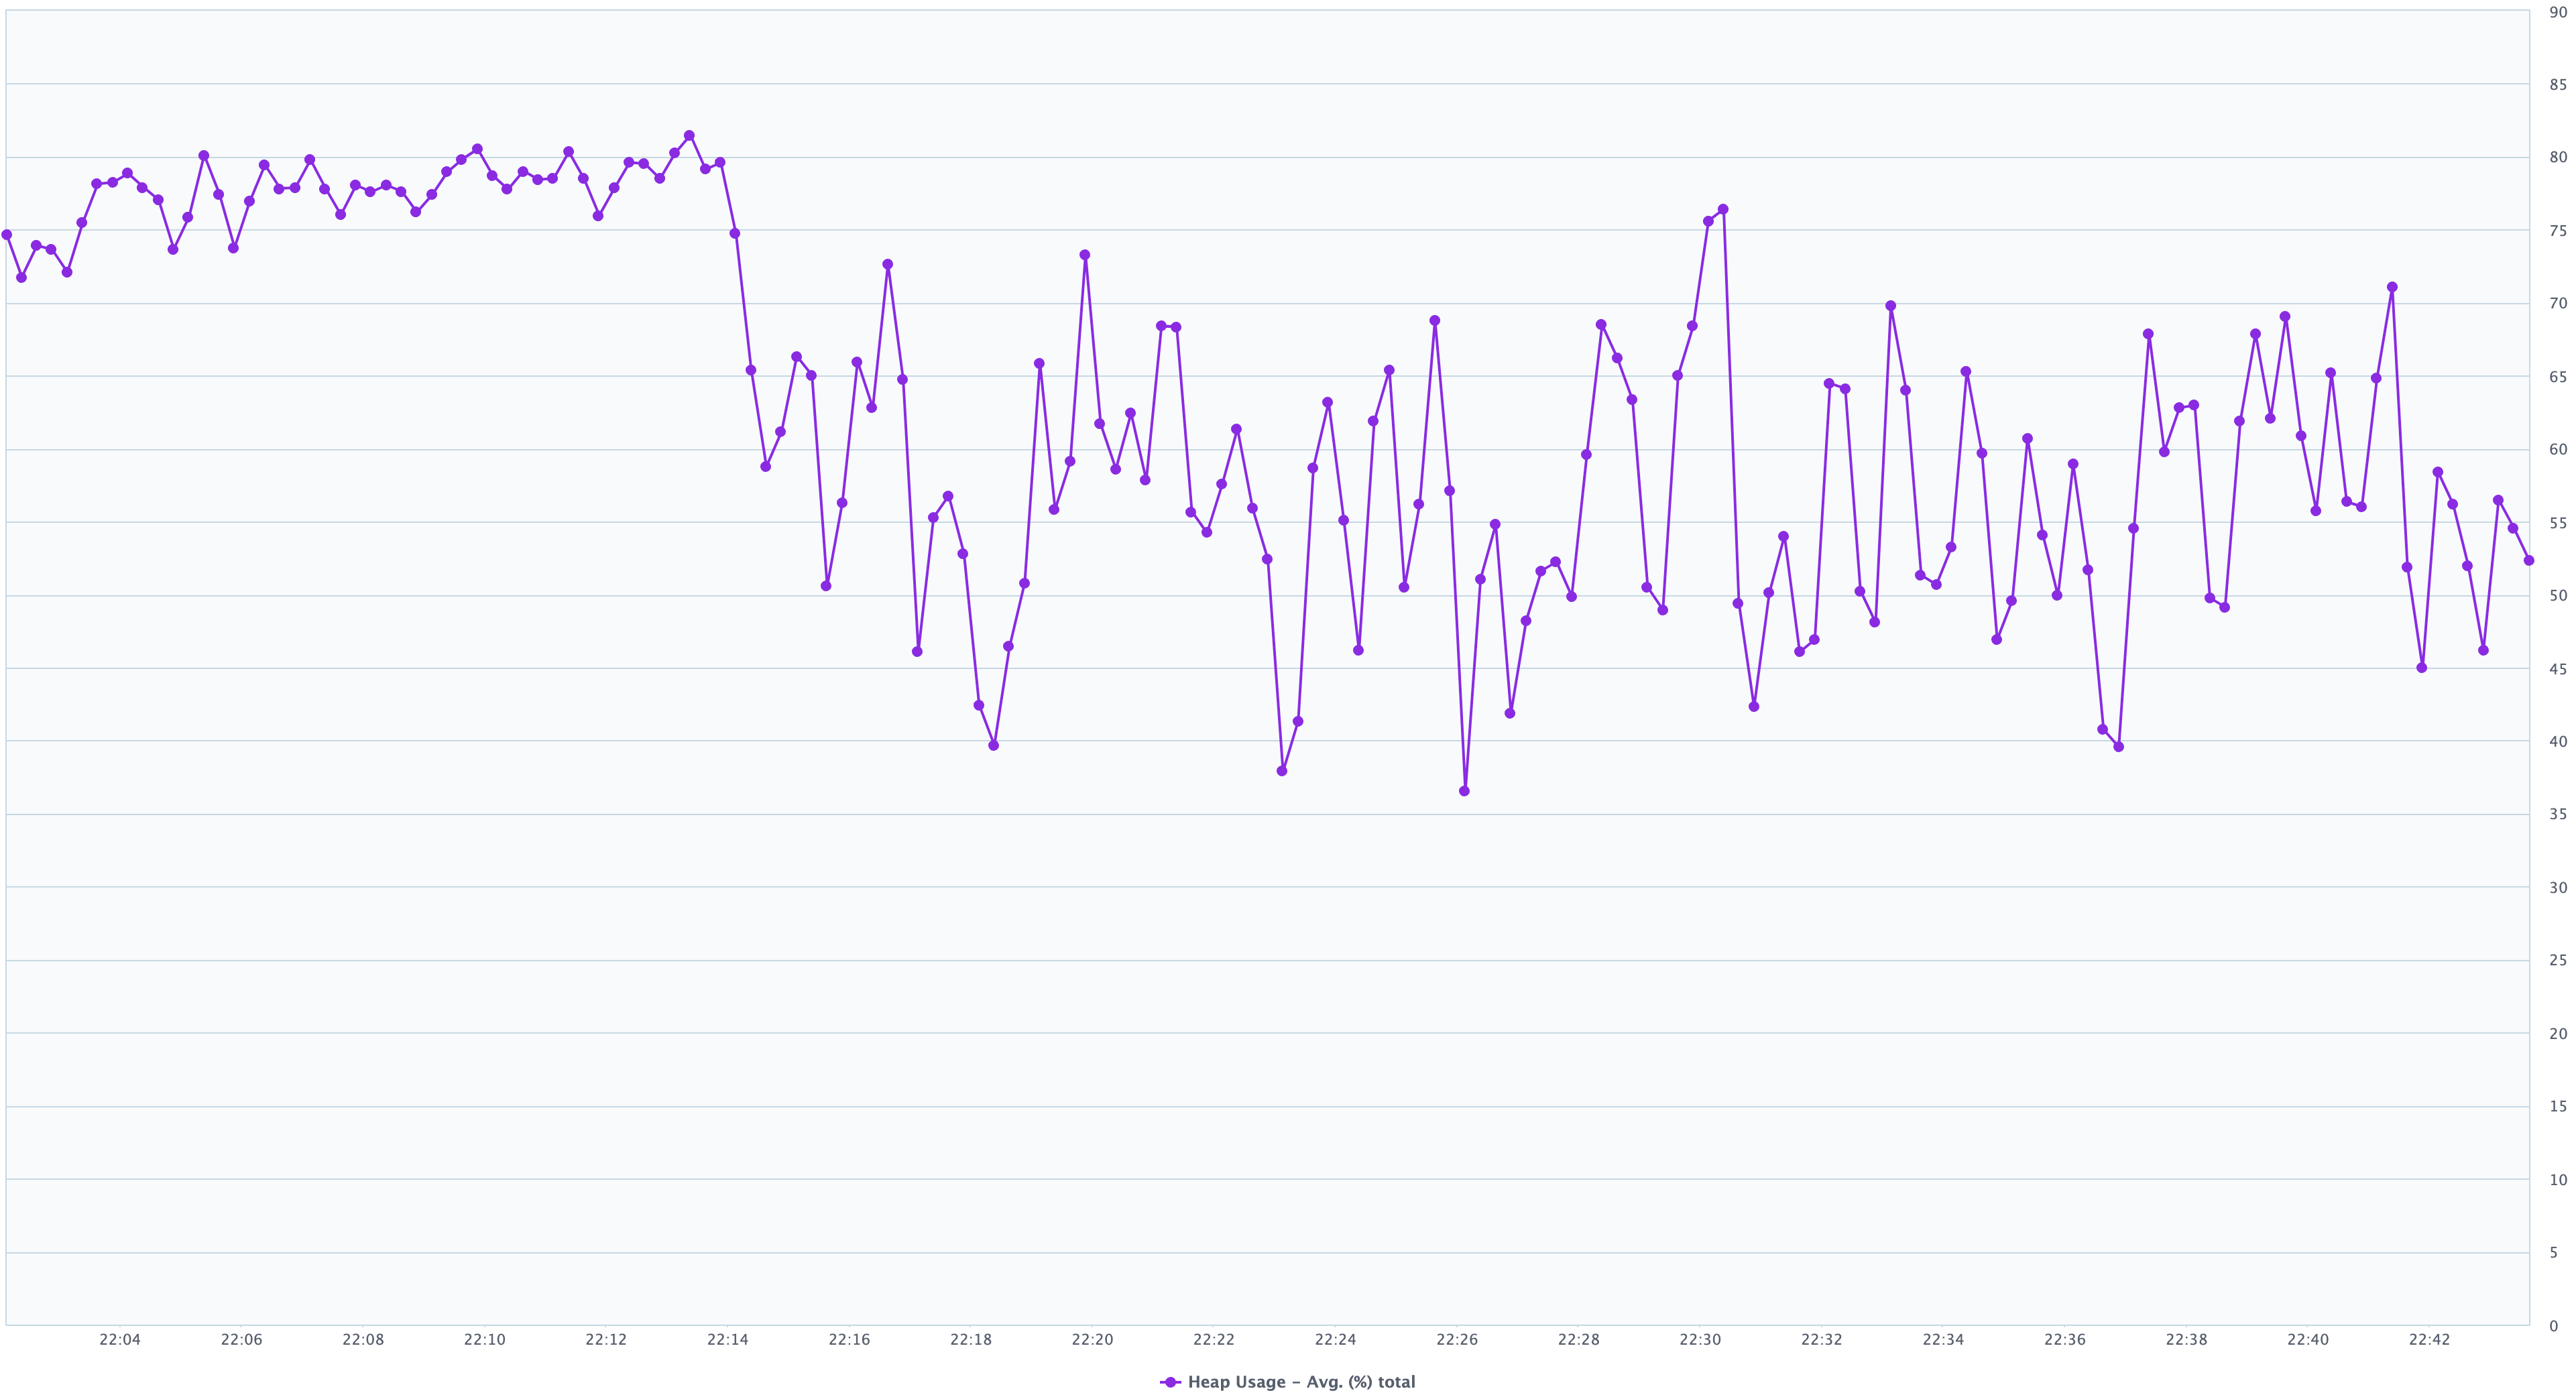
For this test the number of concurrent users started at 0 and increased to a maximum of ~160 users over 30 minutes. The users themselves we’re highly active (above standard) performing high load actions with no regressions in overall performance and hardware metrics and no errors were detected during execution. These were the results observed:
No regressions in the perceived performance of the product (as measured by the response time) between 5.4 and 5.12. With an increasing virtual load by an increasing number of virtual users, the response time remained stable. Note that the spike in response time at the beginning and end are due to start/end of tests.
Similar throughput achieved between 5.4 and 5.12.
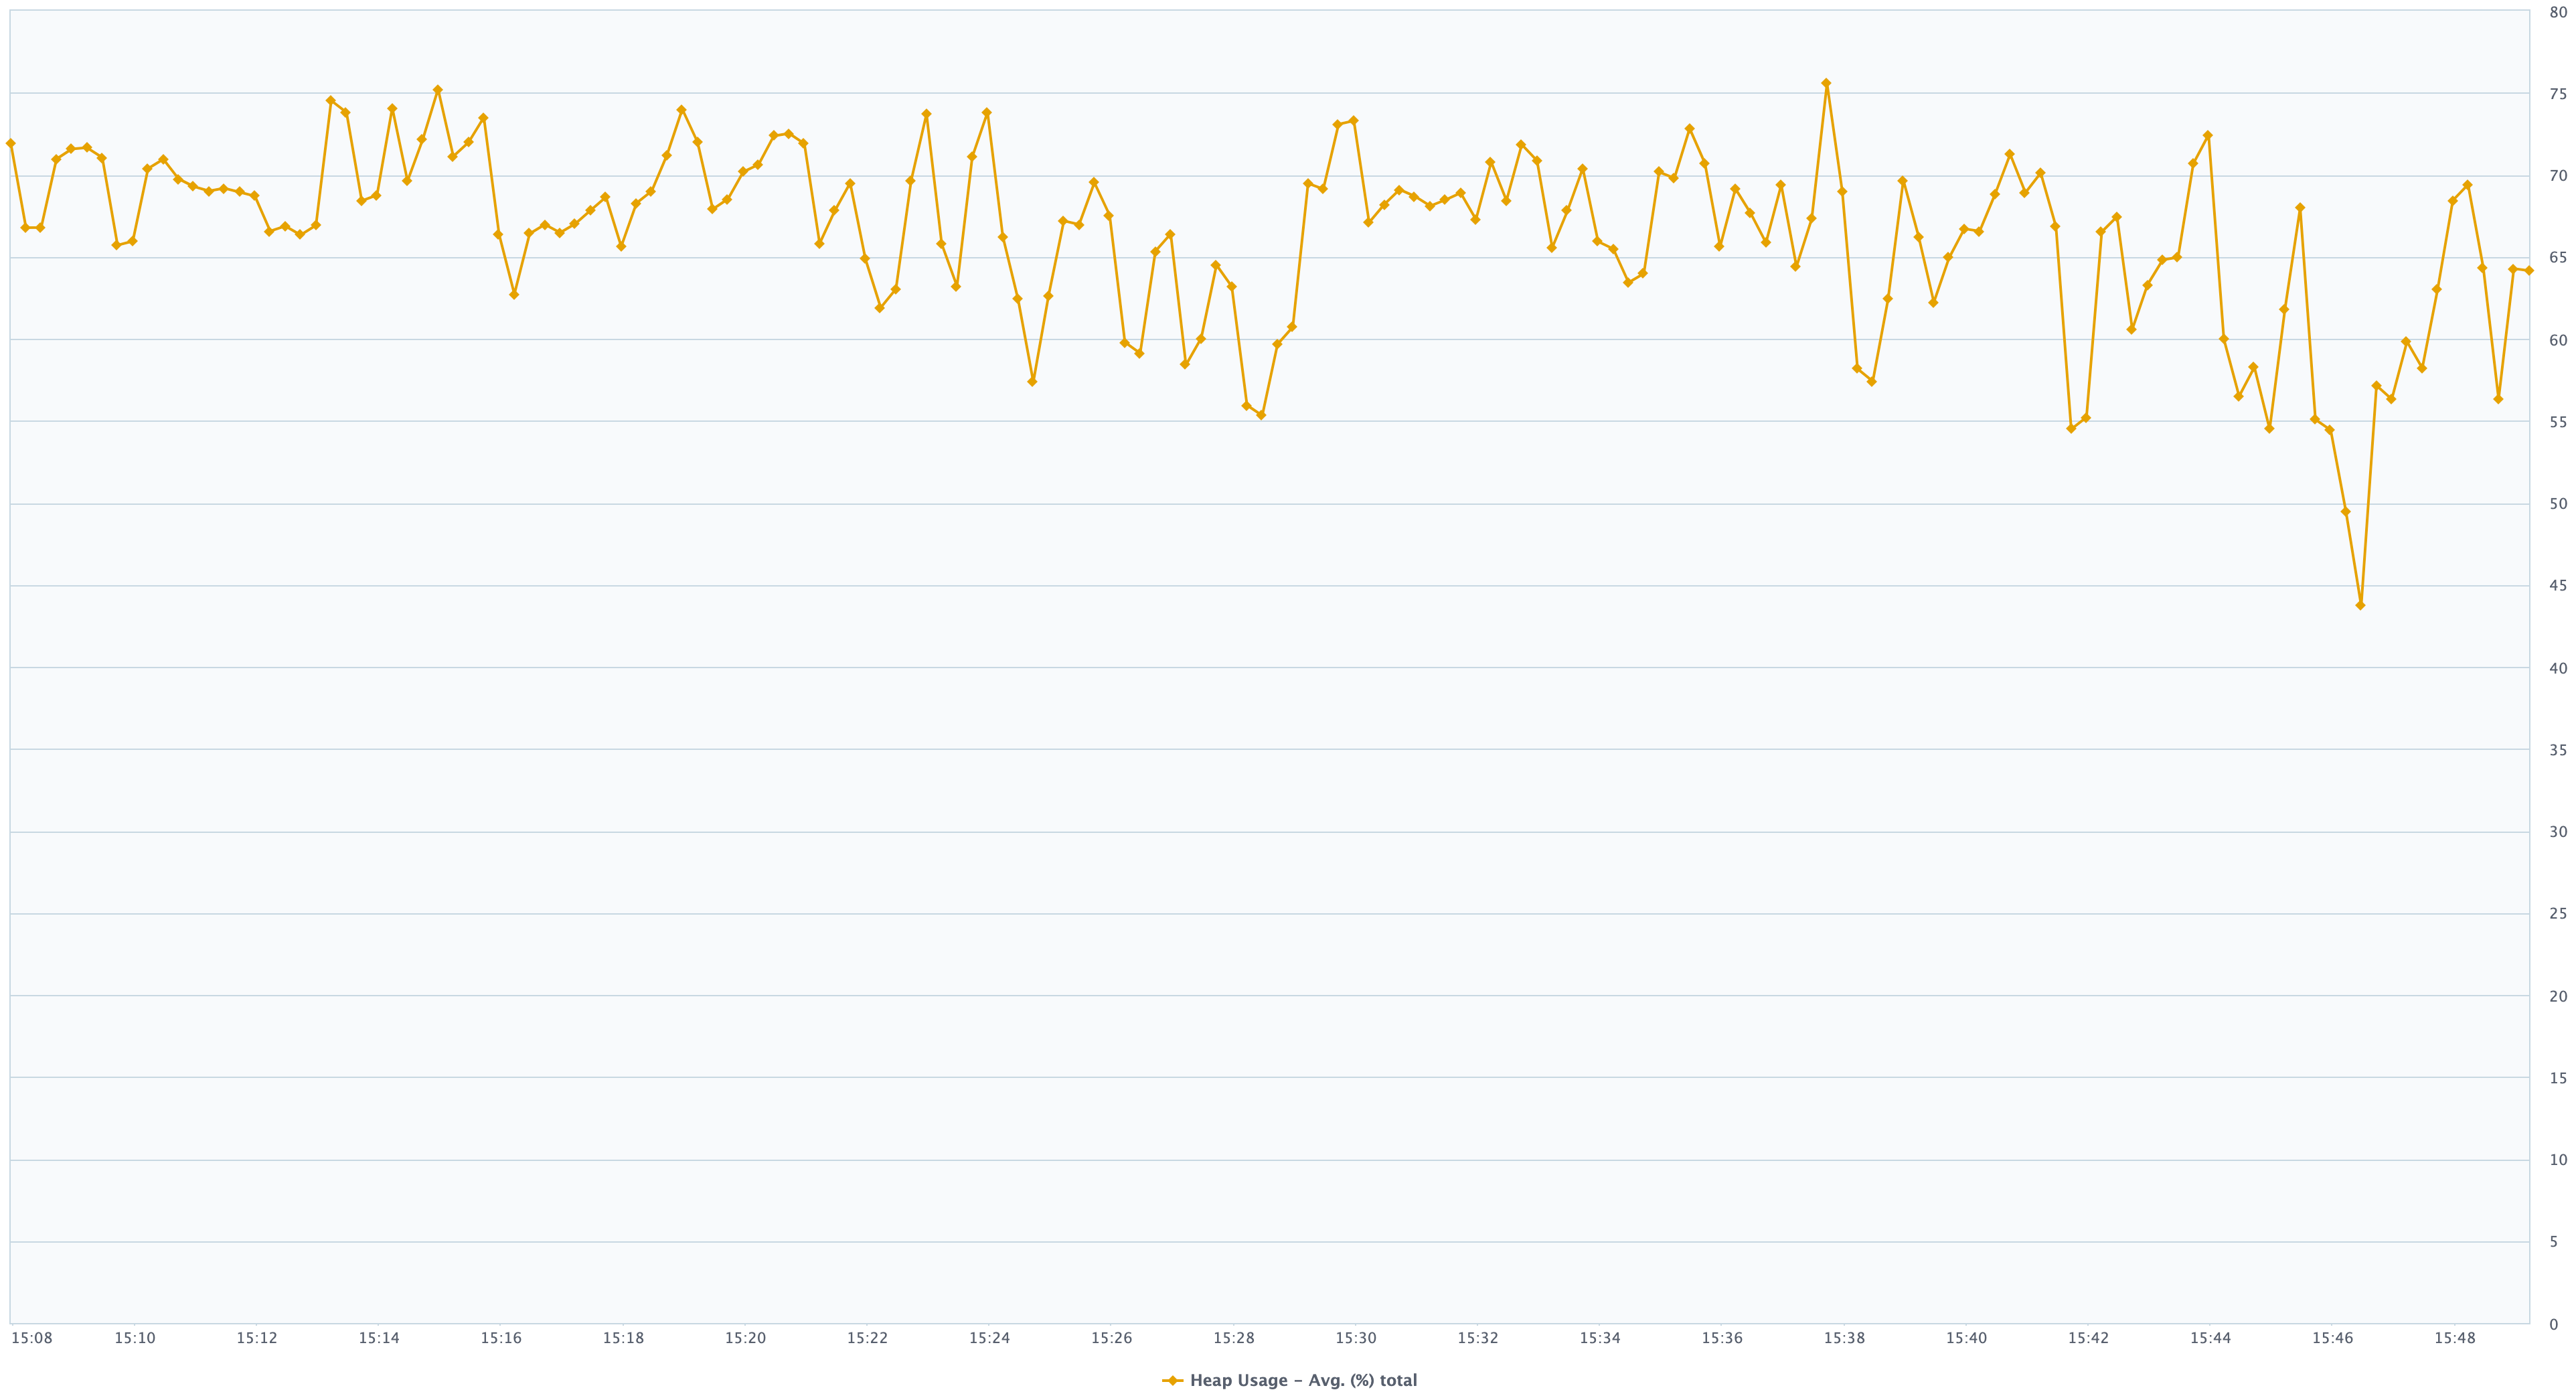
Heap memory usage was steady and roughly the same for both 5.4 and 5.12.
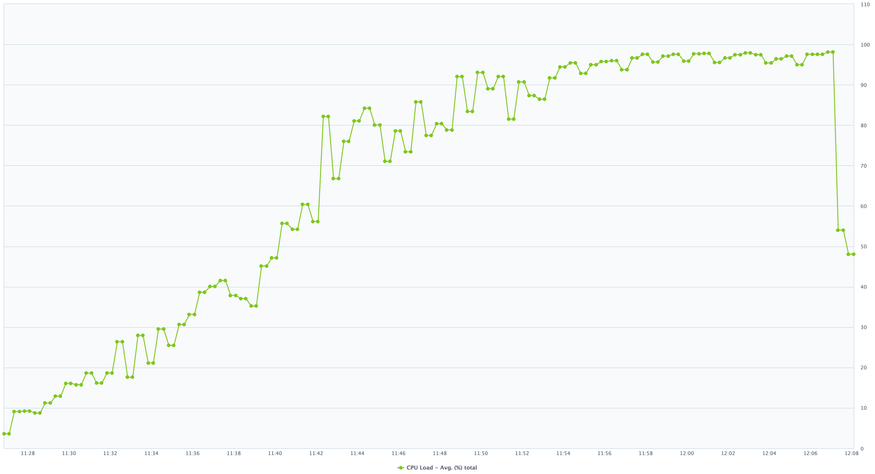
CPU usage was more efficient on 5.12 compared to 5.4.
Multi-node comparisons
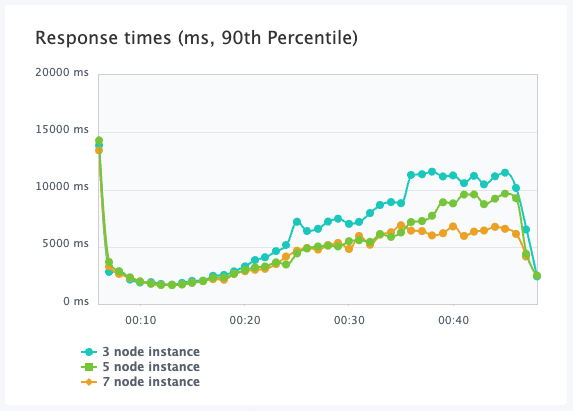
Response time for 3,5, and 7 node 5.12 instances
Throughput time for 3,5, and 7 node 5.12 instances
For this test the number of concurrent users were gradually increased from 0 to 520 virtual users over 30 minutes on 3, 5, and 7 node 5.12 environments. The results indicate significant performance improvements between instances with 3 and 5 nodes. An instance with 5 nodes responds faster, uses less CPU while keeping the same throughput (Hits/s). The occurrence of timeouts also notably decreases on the 5-node instance. However, the performance difference between 5 and 7 nodes is marginal. Therefore, for the scenario and instance sizes simulated, opting for a 5-node configuration is deemed more cost-effective.
Overall average heap memory usage for 3, 5, and 7 node is similar.
Performance summary for Assets heavy profile
Constant load test
For this test, a constant load was applied for 40 minutes and the median response time observed.
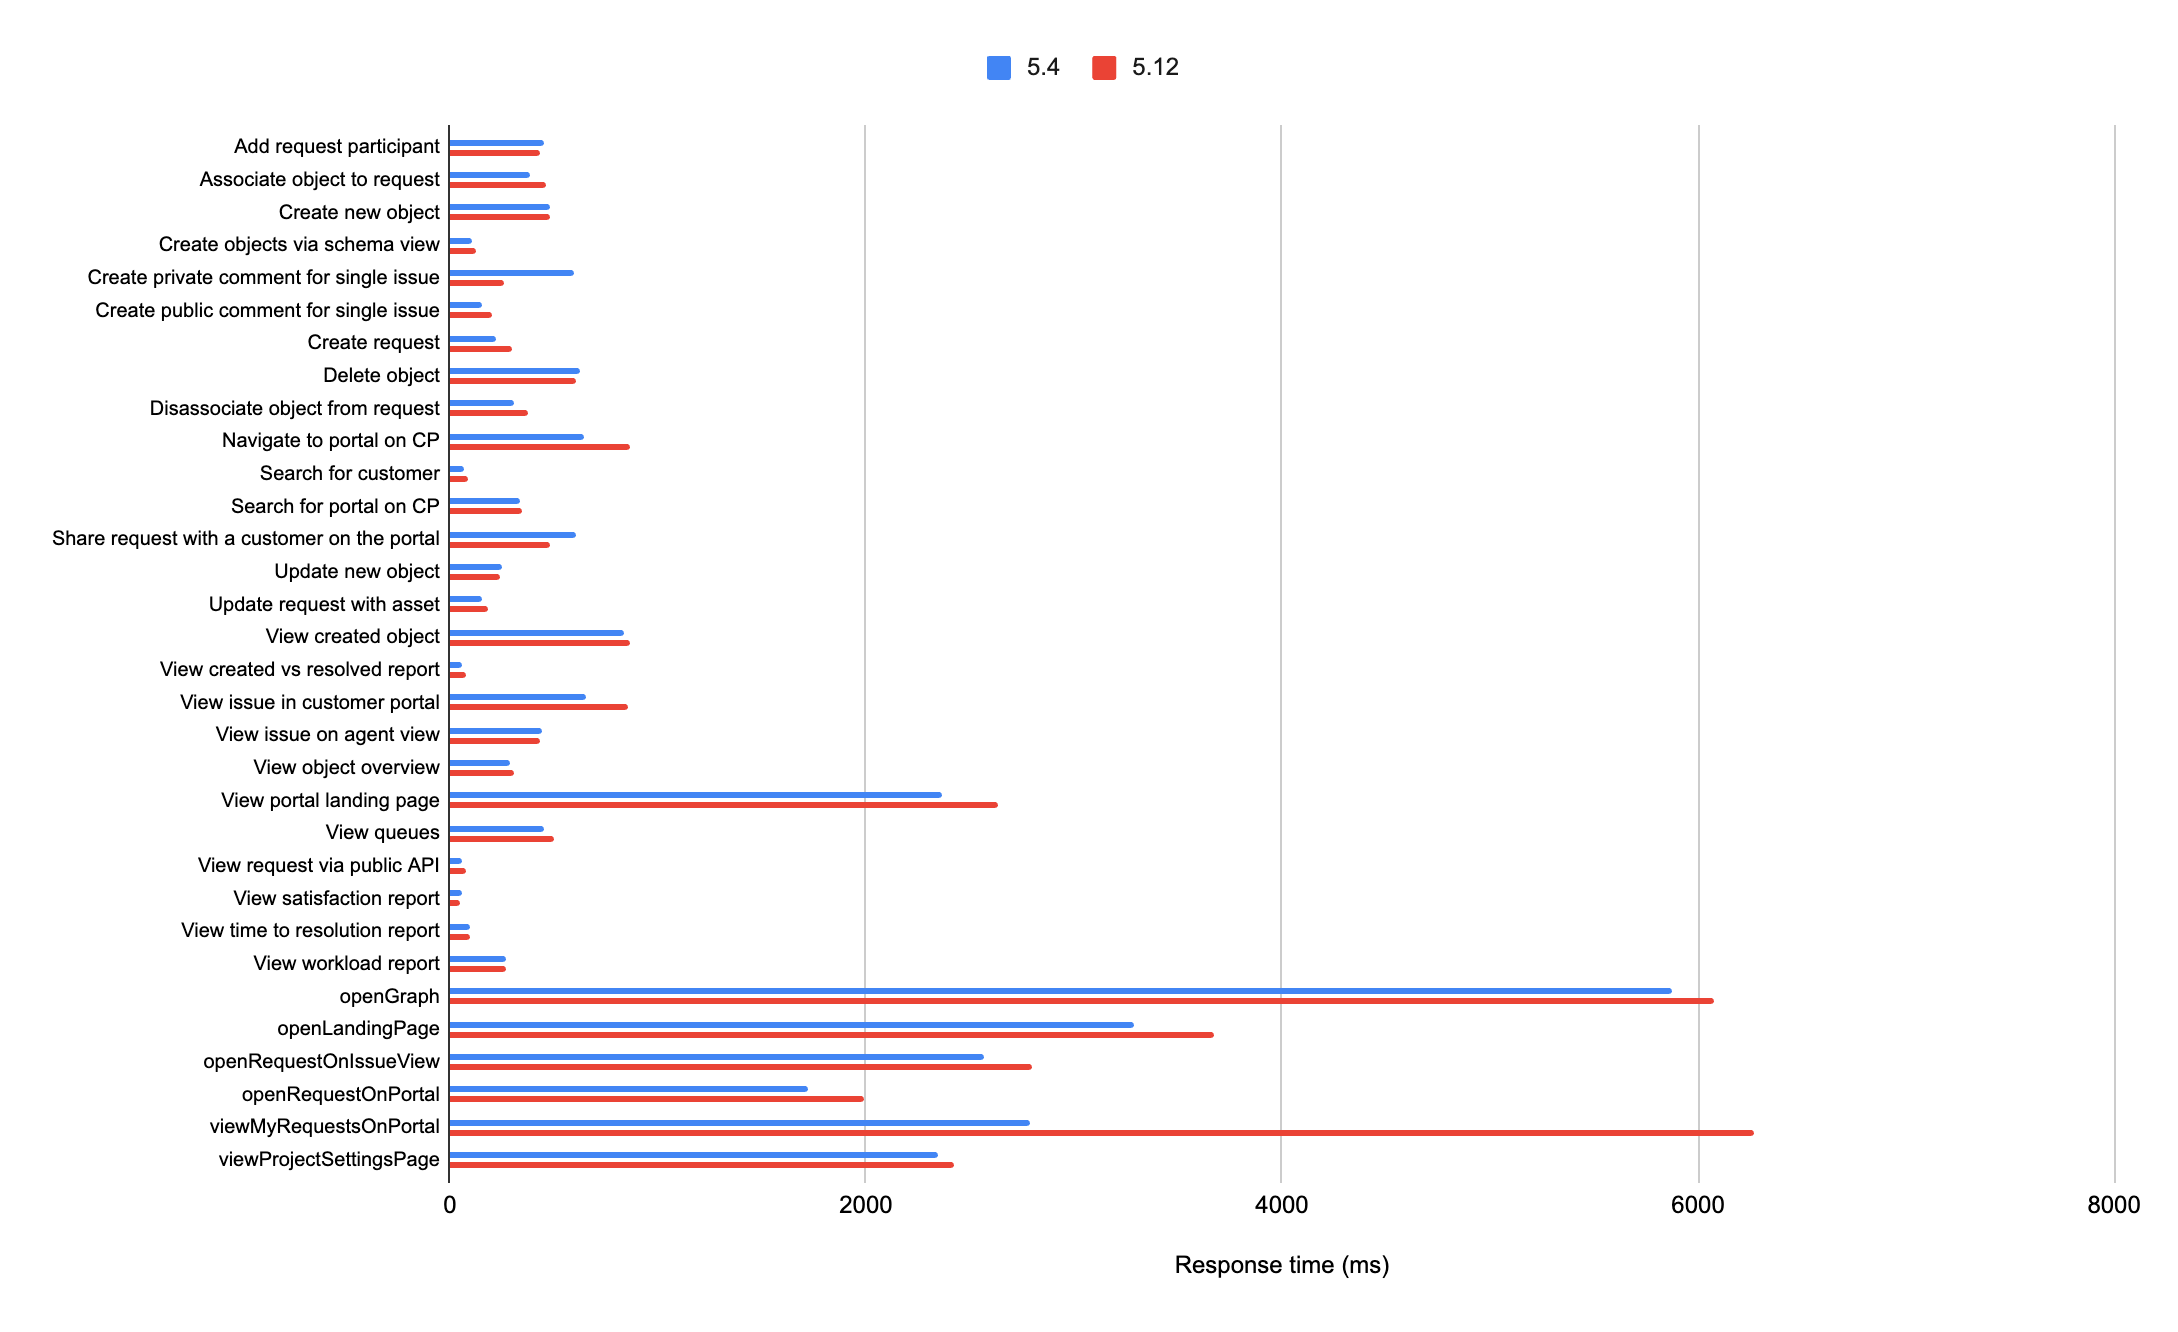
The graph below shows the differences in response times of individual actions between 5.12 and 5.4.10. The data used to build the graph is below.
Note that, the performance of the Assets heavy profile is similar to the Service heavy profile. The data strongly indicates that the adoption of Assets doesn’t negatively impact the overall health of the system. Assets usage can involve heavy actions that add to the load. Learn more about the significant performance improvements we’ve shipped in Assets
Increasing load test
For this test the number of concurrent users started at 0 and increased to a maximum of ~320 users over 30 minutes. The load was then held for 10 minutes. The users themselves we’re highly active (above standard) performing high load actions with no regressions in overall performance and hardware metrics and no errors were detected during execution. These were the results observed:
- No regressions in the perceived performance of the product (as measured by the response time) between 5.4 and 5.12. With an increasing virtual load by an increasing number of virtual users the response time remained stable. Note that, spike in response time at the beginning and end are due to start/end of tests.
- Similar throughput achieved between 5.4 and 5.12.
- CPU load for 5.12 and 5.4 started off higher and lowered when load stabilized. Average CPU usage for 5.12 is higher than 5.4.
- Heap memory usage was steady and roughly the same for both 5.4 and 5.12.
Multi-node comparisons
For this test, an increasing load of up to ~500 users was applied to 3, 5, and 7 node 5.12 environments.
The multi node comparisons for an Assets heavy profile are for the most part similar to the result of the Service heavy. However, for the Assets heavy profile the 7-node profile was much more performant than 5-nodes. Most likely due to the CPU and memory usage. We can observe that having more nodes improved the hardware metrics' usage performance in this profile.
Response time for 3,5, and 7 node 5.12 instances
Throughput time for 3,5, and 7 node 5.12 instances
Known issues
As noted earlier, are aware of performance issues around the ‘View my requests on the customer portal’ scenario when rendering one of the combobox filters. We aim to fix the regression in Jira Service Management 5.12.1 bugfix release or 5.13.0.


