Jira Service Management 10.3.x Long Term Support release performance report
We’re committed to continuously evolving and enhancing the quality of our performance reports. This report presents a comprehensive overview of the performance metrics for the most recent 10.3 Long Term Support (LTS) release of Jira Service Management Data Center.
About Long Term Support releases
We recommend upgrading Jira Service Management regularly, but if your organization's process means you only upgrade about once a year, upgrading to a Long Term Support release is a good option. It provides continued access to critical security, stability, data integrity, and performance fixes until this version reaches end of life.
TL;DR
In Jira Service Management Data Center 10.3 LTS, we've introduced a new performance testing framework that captures performance more accurately by using NFR thresholds, mimicking the end user experience more closely.
Our tests are conducted on datasets that mimic an extra-large cohort on minimal recommended hardware to provide performance thresholds achievable for all of our customers.
We routinely carry out internal performance testing to ensure that all actions remain within the NFR thresholds. Our continuous monitoring enables us to optimize performance and effectively address any regressions.
We conducted tests with the new framework on versions 5.12 and 10.3 using a comparable setup and found no major regressions.
The report below presents test results conducted using non-optimal data shape or hardware and doesn’t represent Jira’s peak performance. Instead, it showcases the performance of a Jira instance typically encountered for customers in an extra-large cohort.
However, we also provide guidance on optimizing your instance to achieve performance that surpasses the results shown in this test. Learn more details
Summary
In the JSM 10.3 release, we’re showcasing the results of our performance testing through a new framework that focuses on Non-Functional Requirements (NFR) thresholds for essential user actions. These thresholds serve as benchmarks for reliability, responsiveness, and scalability, ensuring that our system adheres to the expected performance standards. We've successfully delivered features that significantly impact the product and consistently addressed performance regressions to pass all NFR tests. You can be confident that as the product evolves and you scale, we’ll remain dedicated to optimizing and maintaining the performance.
Testing methodology
Testing methodology
Our testing methodology incorporates both browser testing and REST API call assessments. Each test was scripted to execute actions based on the scenarios outlined above.
For the browser tests, we conducted 500 samples per test. The REST API tests were performed as soak tests over a duration of one hour. Upon completion of all browser and REST API tests, we gathered instance metrics and statistics for analysis.
Test environment
The performance tests were all run on a set of AWS EC2 instances, deployed in the ap-southeast-2 region. The tested instance was an out-of-the-box fresh installation setup as 5 nodes and without any additional configuration. This approach allowed us to ensure satisfying performance in a basic setup with more nodes adding additional performance gains if necessary.
Below, you can check the details of the environments used for Jira Service Management Data Center and the specifications of the EC2 instances.
Hardware | Software | ||
EC2 type: | r5d.8xlarge | Operating system | Ubuntu 20.04.6 LTS |
Nodes | 5 nodes | Java platform | Java 17.0.11 |
Java options | 24 GB heap size | ||
Database
Hardware | Software | ||
EC2 type: | db.m6i.4xlarge | Database: | Postgres 15 |
Operating system: | Ubuntu 20.04.6 LTS | ||
Load generator
Hardware | Software | ||
CPU cores: | 2 | Browser: | Headless Chrome 130.0.6723.31 |
Memory | 8 GB | Automation script: | JMeter Playwright |
Test dataset
Before we started testing, we needed to determine what size and shape of the dataset represents a typical extra large Jira Service Management instance. To achieve that, we created a new dataset that more accurately matches the instance profiles of Jira Service Management in very large organizations.
The data was collected based on the anonymous statistics received from real customer instances. A machine-learning (clustering) algorithm was used to group the data into small, medium, large, and extra-large instances data shapes. For our tests, we decided to use median values gathered from extra-large instances.
In Jira & JSM 10.1, we introduced a new feature allowing instances to send a basic set of data that we use to improve the size of our testing datasets. Learn more about how you can send your instance's anonymized info to improve our dataset
The following table presents the dataset we used in our tests. It simulates a data shape typical in our extra-large customer cohort.
Data | Value |
|---|---|
Admins | 31 |
Agents | 6,471 |
Attachments | 1,871,808 |
Comments | 7,037,281 |
Components | 13,674 |
Custom fields | 492 |
Customers | 203,107 |
Groups | 1,006 |
Issue types | 19 |
Issues | 4,985,973 |
Jira users only | 0 |
Priorities | 7 |
Projects | 3,447 |
Resolutions | 8 |
Screen schemas | 5,981 |
Screens | 34,649 |
Statuses | 26 |
All users (including customers) | 209,578 |
Versions | 0 |
Workflows | 8,718 |
Object attributes | 15,491,004 |
Objects | 2,006,541 |
Object schemas | 304 |
Object types | 7,113 |
Testing results
NFR tests
This year, we've introduced a new set of test results based on a framework that focuses on Non-Functional Requirements (NFR) thresholds for key user actions.
We've established a target threshold for each measured action. These thresholds, set according to the action type, serve as benchmarks for reliability, responsiveness, and scalability, ensuring that our product meets the expected performance standards. We're committed to ensuring that we don’t deliver performance regressions, maintaining the quality and reliability of our product.
It’s important to clarify that the thresholds outlined in this report aren't the targets we strive to achieve; rather, they represent the lower bound of accepted performance for extra-large instances. Performance for smaller customers can and should be significantly better.
Action type | Response time | |
|---|---|---|
50th percentile | 90th percentile | |
Page load | 3 s | 5 s |
Page transition | 2.5 s | 3 s |
Backend interactions | 0.5 s (500 ms) | 1 s |
The measured performance of the action was defined as the time from the beginning of an action until the action is performed and the crucial information is visible. Thanks to this approach, we can more closely measure the performance as it's perceived by the end user.
The following interpretations of the response times apply:
50th percentile - Gives a clear understanding of the average performance for most users in extra-large instances. It's less affected by extreme outliers, so it shows the central tendency of response times.
90th percentile - Highlights performance for worst-case scenarios, which may affect a smaller, but still noteworthy, portion of users in the extra-large instances.
Note that:
We routinely carry out internal performance testing to ensure that all actions remain within the NFR thresholds. Our continuous monitoring enables us to optimize performance and effectively address any regressions.
All actions had a 0% error rate, demonstrating strong system reliability and stability. For the list of bugs resolved since the previous 5.12 LTS, refer to the Jira Service Management 10.3 LTS release notes.
The results overall are as follows:
All the actions below achieved a PASS status within the 10.3 LTS.
Action | Response time | Target threshold | Achieved performance | |
|---|---|---|---|---|
Service project - agent experience | ||||
View issue on agent view | 50th percentile | 3,000 ms | 437 ms | |
90th percentile | 5,000 ms | 502 ms | ||
View agent queues page | 50th percentile | 3,000 ms | 2,311 ms | |
90th percentile | 5,000 ms | 2,385 ms | ||
Add request participants on agent view | Search for request participant | 50th percentile | 500 ms | 184 ms |
90th percentile | 1,000 ms | 370 ms | ||
Submit request participant | 50th percentile | 500 ms | 417 ms | |
90th percentile | 1,000 ms | 840 ms | ||
Create Comment on Agent View | Create private comment on agent view | 50th percentile | 800 ms | 513 ms |
90th percentile | 1,300 ms | 689 ms | ||
Create public comment on agent view | 50th percentile | 800 ms | 530 ms | |
90th percentile | 1,300 ms | 693 ms | ||
Associate asset to issue on agent view | 1. Open edit issue dialog | 50th percentile | 2,500 ms | 1,047 ms |
90th percentile | 3,000 ms | 1,102 ms | ||
2. Select asset | 50th percentile | 500 ms | 190 ms | |
90th percentile | 1,000 ms | 273 ms | ||
3. Submit dialog | 50th percentile | 2,500 ms | 483 ms | |
90th percentile | 3,000 ms | 603 ms | ||
Disassociate asset from issue on agent view | 1. Disassociate asset | 50th percentile | 500 ms | 379 ms |
90th percentile | 1,000 ms | 395 ms | ||
2. Submit field | 50th percentile | 500 ms | 494 ms | |
90th percentile | 1,000 ms | 602 ms | ||
Service project - help seeker experience | ||||
Add attachment to comment on Customer Portal | 1. Add attachment to comment | 50th percentile | 500 ms | 196 ms |
90th percentile | 1,000 ms | 205 ms | ||
2. Submit comment with attachment | 50th percentile | 500 ms | 413 ms | |
90th percentile | 1,000 ms | 416 ms | ||
Add comment to request on Customer Portal | 50th percentile | 500 ms | 416 ms | |
90th percentile | 1000 ms | 433 ms | ||
Create request via Customer Portal | 1. Open create request page | 50th percentile | 3,000 ms | 1,780 ms |
90th percentile | 5,000 ms | 2,183 ms | ||
2. Submit form and wait for request creation | 50th percentile | 3,000 ms | 1,141 ms | |
90th percentile | 5,000 ms | 2,119 ms | ||
Open portal landing page | 50th percentile | 3,000 ms | 2,269 ms | |
90th percentile | 5,000 ms | 3,033 ms | ||
Open request on Customer Portal | 50th percentile | 3,000 ms | 1,138 ms | |
90th percentile | 5,000 ms | 1,528 ms | ||
Share request on Customer Portal | 1. Search for participant | 50th percentile | 800 ms | 484 ms |
90th percentile | 1,300 ms | 522 ms | ||
2. Share request with participant | 50th percentile | 500 ms | 304 ms | |
90th percentile | 1,000 ms | 389 ms | ||
View my requests on Customer Portal | 50th percentile | 3,000 ms | 1,637 ms | |
90th percentile | 5,000 ms | 1,965 ms | ||
Service project - admin experience | ||||
Search for customer on customer page | 1. Load customers page | 50th percentile | 3,000 ms | 2,073 ms |
90th percentile | 5,000 ms | 2,165 ms | ||
2. Search for customer on customers page | 50th percentile | 500 ms | 56 ms | |
90th percentile | 1,000 ms | 61 ms | ||
View customers of an organization | 50th percentile | 3,000 ms | 1,283 ms | |
90th percentile | 5,000 ms | 1,341 ms | ||
View legacy automation page | 50th percentile | 3,000 ms | 1,469 ms | |
90th percentile | 5,000 ms | 1,517 ms | ||
View project settings | 50th percentile | 3,000 ms | 1,850 ms | |
90th percentile | 5,000 ms | 1,909 ms | ||
View reports | View satisfaction report | 50th percentile | 3,000 ms | 1,45 ms |
90th percentile | 5,000 ms | 149 ms | ||
View time to resolution report | 50th percentile | 3,000 ms | 1,349 ms | |
90th percentile | 5,000 ms | 1,406 ms | ||
View Created vs resolved report | 50th percentile | 3,000 ms | 1,405 ms | |
90th percentile | 5,000 ms | 1,466 ms | ||
View workload report | 50th percentile | 3,000 ms | 2,905 ms | |
90th percentile | 5,000 ms | 3,811 ms | ||
Assets | ||||
Create asset on schema view | 1. Open create asset dialog | 50th percentile | 2,500 ms | 145 ms |
90th percentile | 3,000 ms | 224 ms | ||
2. Submit dialog | 50th percentile | 2,500 ms | 170 ms | |
90th percentile | 3,000 ms | 180 ms | ||
Create issue | 1. Open create issue page | 50th percentile | 3,000 ms | 1,982 ms |
90th percentile | 5,000 ms | 2,129 ms | ||
2. Submit form and wait for request creation | 50th percentile | 3,000 ms | 614 ms | |
90th percentile | 5,000 ms | 730 ms | ||
Delete asset object - Submit and delete asset dialog | 50th percentile | 2,500 ms | 91 ms | |
90th percentile | 3,000 ms | 98 ms | ||
Update asset object | 1. Open update asset dialog | 50th percentile | 2,500 ms | 104 ms |
90th percentile | 3,000 ms | 115 ms | ||
2. Submit update asset dialog | 50th percentile | 2,500 ms | 161 ms | |
90th percentile | 3,000 ms | 412 ms | ||
View asset on object view | 50th percentile | 3,000 ms | 2,079 ms | |
90th percentile | 5,000 ms | 2,135 ms | ||
View asset on schema view | 50th percentile | 3,000 ms | 2,891 ms | |
90th percentile | 5,000 ms | 3,039 ms | ||
Constant load test
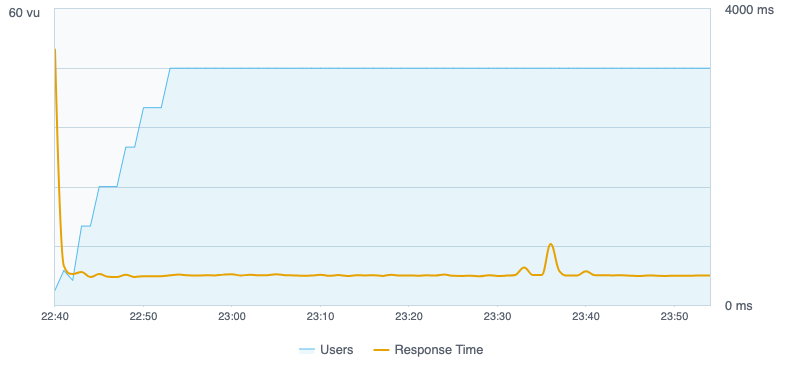
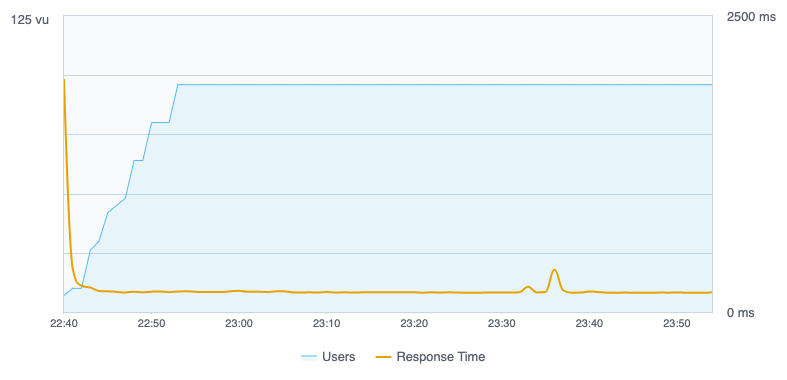
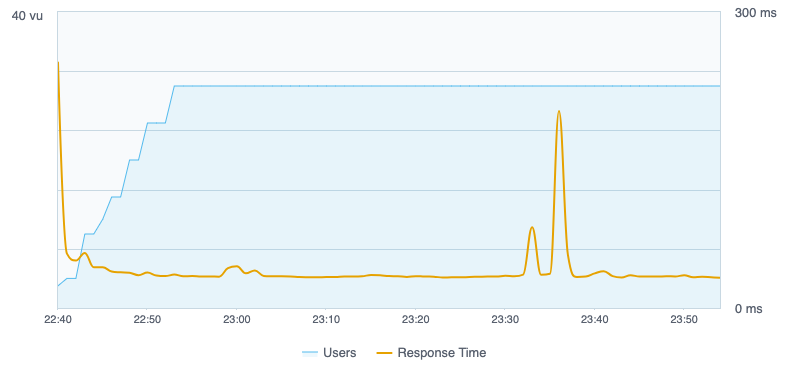
For this test, a constant load was sustained for one hour. The test started with 0 concurrent users, gradually increasing to a peak of approximately 160 users over a span of 15 minutes. The users were highly active, performing high-load actions above the standard level. All actions were executed concurrently, and later categorized into three groups: help seeker, agent, and assets, illustrating the expected performance for each persona. The results are as follows:
No regressions were observed in overall performance or hardware metrics.
No significant error detected during execution.
Throughout one hour of sustained load, response times remained stable for all actions. Note that:
Spike in response time at the beginning are due to start of tests.
Small spikes observed in the latter half of the sustained load period are due to garbage collection activities. The system recovers quickly from these spikes which are considered acceptable and expected.
CPU and memory usage consistently held steady across all actions.
Help seeker actions
Agent actions
Assets actions
Multi-node comparison
For this test, the number of concurrent users were gradually increased from 0 to 560 virtual users over a span of 15 minutes, followed by a sustained load for one hour, with environments with 3, 5, and 7 nodes.
The results indicate significant performance improvements between instances with 3 and 5 nodes. An instance with 5 nodes responds faster, uses less CPU while keeping the same throughput (hits/s). The occurrence of timeouts also notably decreases on the 5-node instance. However, the performance difference between 5 and 7 nodes is marginal. Therefore, for the scenario and instance sizes simulated, opting for a 5-node configuration is deemed more cost-effective.
Assets archiving
In Jira Service Management 5.15, we introduced the ability to archive Assets objects. You can now declutter your instance and improve the performance of object searches by archiving the assets you no longer actively need. Previously, you had to permanently delete objects when your available index memory was low to make room for new objects. Now, you can archive objects instead. More about archiving objects
Here are some of the observed effects of effectively using Assets archiving:
Archiving objects can enhance the performance of operations involving all objects by approximately 20%. In a scenario where there are 2 million objects, with 600,000 of them archived, processes like Assets clean reindexing and resource-intensive AQL queries (for example the anyAttribute query) experience a 20% increase in speed.
Average CPU usage is up to 30% less when reindexing and running AQL searches with archived objects.
Total memory usage decreased by 35% when running Assets indexing with archived objects.
Further resources for scaling and optimizing
If you'd like to learn more about scaling and optimizing JSM, here are a few additional resources that you can refer to.
Jira Service Management guardrails
Product guardrails are data-type recommendations designed to help you identify potential risks and aid you in making decisions about the next steps in your instance optimization journey. Learn more about JSM guardrails
Jira Enterprise Services
For help with scaling JSM in your organization directly from experienced Atlassians, check out our Additional Support Services offering.
Atlassian Experts
The Atlassian Experts in your local area can also help you scale Jira in your own environment.


