Jira Service Desk 4.5.x Long Term Support release performance report
This page compares the performance of Jira Service Desk 3.16.6 and Jira Service Desk 4.5 Long Term Support release.
 About Long Term Support releases
We recommend upgrading Jira Service Desk regularly, but if your organisation's process means you only upgrade about once a year, upgrading to a Long Term Support release is a good option. It provides continued access to critical security, stability, data integrity and performance issues until this version reaches end of life.
Performance
Jira Service Desk 4.5 was not focused solely on performance, but we aim to provide the same, if not better, performance with each release. In this section, we’ll compare Jira Service Desk 3.16.6 to Jira Service Desk 4.5, for both Server and Data Center. We ran the same extensive test scenario for both versions.
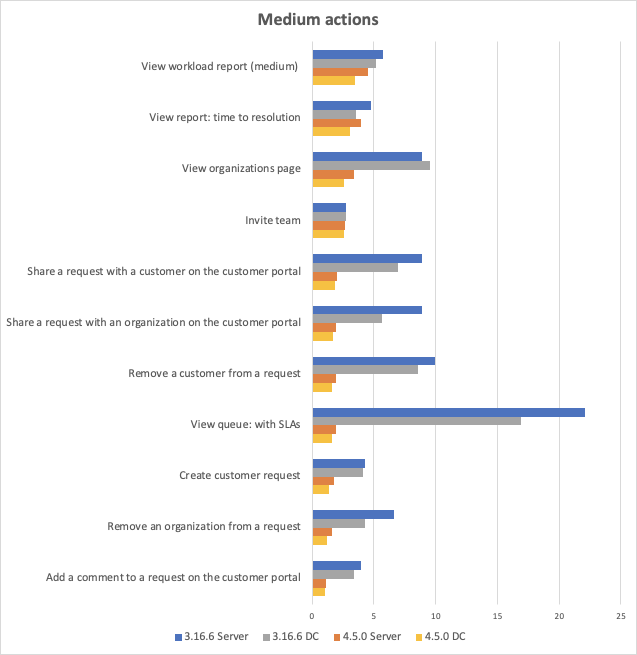
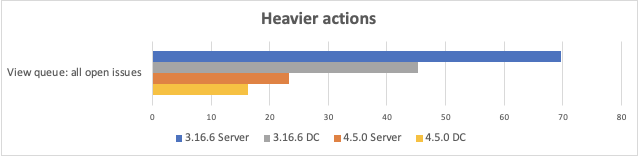
The following graphs present the difference in mean response times of individual actions performed in Jira Service Desk, separated into 3 categories: Heavier actions (takes longer to run), Medium actions and lighter actions (faster to run). Under the graphs, you can click on the "Click to see the data in a table" link to see the mean response times.

The performance was measured under a user load we estimate to be peak traffic, on a 5000 users instance.
To check the details of these actions and the Jira instance they were performed in, see Testing methodology.
The following table presents mean response times of individual actions performed in Jira Service Desk.
Action | Average response times (in seconds, lower is better) | |||
| 3.16.6 Server | 4.5.0 Server | 3.16.6 Data Center | 4.5.0 Data Center | |
|---|---|---|---|---|
| View welcome guide | 0.723 | 0.511 | 0.675 | 0.464 |
| View workload report (small) | 1.020 | 0.632 | 1.174 | 0.555 |
| View requests | 1.064 | 0.599 | 0.852 | 0.403 |
| View requests: with filter | 0.662 | 0.431 | 0.482 | 0.279 |
| View a customer request on the customer portal | 0.340 | 0.402 | 0.355 | 0.403 |
| Search for an organization to share a request with | 0.458 | 0.379 | 0.465 | 0.334 |
| Search for a customer to share a request with | 0.546 | 0.338 | 0.472 | 0.339 |
| View queue: all open issues | 69.617 | 23.33 | 45.344 | 16.306 |
| View queue: with SLAs | 22.088 | 1.963 | 16.887 | 1.585 |
| Share a request with a customer on the customer portal | 8.911 | 2.053 | 6.932 | 1.870 |
| Share a request with an organization on the customer portal | 8.934 | 1.963 | 5.690 | 1.736 |
| Remove an organization from a request | 6.664 | 1.644 | 4.281 | 1.194 |
| Remove a customer from a request | 9.928 | 1.957 | 8.541 | 1.612 |
| Create customer request | 4.262 | 1.787 | 4.092 | 1.363 |
| Add a comment to a request on the customer portal | 3.977 | 1.145 | 3.383 | 1.069 |
| View report: time to resolution | 4.758 | 3.989 | 3.549 | 3.046 |
| View organizations page | 8.893 | 3.419 | 9.522 | 2.551 |
| View workload report (medium) | 5.720 | 4.526 | 5.179 | 3.506 |
| Invite team | 2.752 | 2.643 | 2.714 | 2.55 |
| View queue: small | 2.355 | 0.998 | 2.492 | 0.835 |
| View service desk issue | 2.621 | 1.131 | 2.204 | 0.972 |
| View report: created vs resolved | 0.993 | 0.702 | 1.034 | 0.640 |
| View portals page | 1.332 | 1.067 | 1.017 | 0.723 |
| View customers page | 1.649 | 0.709 | 1.547 | 0.606 |
In summary
We have performance improvements in almost all scenarios across the product, under high load. This is our fastest version ever! Highlights:
- Viewing queues with SLAs is now 10x faster
- Adding a comment in the customer portal is now 3x faster
- Viewing queue: all open issues is 3x faster
- Creating a customer request is 2.5x faster
- Viewing customers/organizations page is now 2.5x faster
- Viewing a service desk issue in the agent view is 2x faster
Overall, we have cut down the response time by 20% to 90% in all scenarios with the exception of "Invite team" with no improvements, and a slight 50ms degradation in "View a customer request on the customer portal".
We'll continue to invest in improving future performance, so that service desk teams can move with ease through their workspace, and our largest customers can scale confidently.
Testing methodology
The following sections detail the testing environment, including hardware specification, and methodology we used in our performance tests.
How we tested
Before we started the test, we needed to determine what size and shape of dataset represents a typical large Jira Service Desk instance. To achieve that, we used our Analytics data to form a picture of our customers' environments and what difficulties they face when scaling Jira Service Desk in a large organization.
The following table presents the rounded values of the 99th of each data dimension. We used these values to generate a sample dataset with random test data.
Baseline data set
| Data | Value |
|---|---|
| Comments | 609570 |
| Components | 7195 |
| Custom Fields | 42 |
| Groups | 3 |
| Issue Types | 13 |
| Issues | 302109 |
| Priorities | 5 |
| Projects | 1001 |
| Resolutions | 8 |
| Screen Schemas | 2395 |
| Screens | 14934 |
| Statuses | 23 |
| Users | 101003 |
| Versions | 3 |
| Workflows | 3717 |
Actions performed
We chose a mix of actions that would represent a sample of the most common user actions. An action in this context is a complete user operation, like opening an issue in the browser window. The following table details the actions that we included in the script, for our testing persona, indicating how many times each action is repeated during a single test run.
| Action | Description | Number of times an action is performed in a single test run |
|---|---|---|
| Add a comment to a request on the customer portal | Open a random customer request in the portal and, as an agent, add a random comment to it | ~200 |
| Create customer request | Open a customer portal, type in the issue summary and description, then submit the request. | ~200 |
| Invite team | Select Invite team in the left-hand-side menu, search for an agent on a 1,000 agent instance, choose an agent, click the Invite button, and wait for success confirmation. | ~300 |
| Remove a customer from a request | Open a random customer request in the portal, and remove a random customer on the "shared with" column | ~100 |
| Remove an organization from a request | Open a random customer request in the portal, and remove a random organization on the "shared with" column | ~100 |
| Search for an organization to share a request with | Open a random customer request in the portal, and search for a random organization to share the request with | ~100 |
| Search for a customer to share a request with | Open a random customer request in the portal, and search for a random customer to share the request with | ~100 |
| Share a request with an organization on the customer portal | Open a random customer request in the portal, and share the request with a random organization | ~100 |
| Share a request with a customer on the customer portal | Open a random customer request in the portal, and share the request with a random customer | ~100 |
| View workload report (small) | Display the workload report for a project with no open issues. | ~1000 |
| View workload report (medium) | Display the workload report for a project with 1,000 assigned issues and 700 agents. | ~1500 |
| View queue: all open issues | Display the default service desk queue, in a project with over 10,000 open issues. | ~930 |
| View queue: small | Display a custom service desk queue that will filter out most of the issues, in a project with over 10,000 open issues. | ~2500 |
| View queue: with SLAs | Display a custom service desk queue, in a project with over 10,000 open issues, with 6 SLA values for each issue. | ~2500 |
| View customers page | Display the Customers page, in a project that has 100,000 customers. | ~1000 |
| View organizations page | Display the Customers page, in a project that has 50 organizations and 300 customers. | ~1000 |
| View portals page | Display the help center, with all customer portals, by selecting the unique help center link. | ~2000 |
| View report: created vs resolved | Display the Created vs Resolved report (in the past year), with over 10,000 issues in the timeline. | ~2000 |
| View report: time to resolution | Display the Time to resolution report (in the past year), with over 10,000 issues in the timeline. | ~2000 |
| View requests | Display the My requests screen from the customer portal. | ~3000 |
| View requests: with filter | Display the My requests screen from the customer portal, filtering the results with a single word in the summary. | ~3000 |
| View service desk issue | Display a service desk issue with 6 SLA values in the Agent view. | ~3000 |
| View a customer request on the customer portal | Display a random issue in the customer portal | ~400 |
| View welcome guide | Display the Welcome guide from the left-hand-side menu. | ~1000 |
Test environment for user actions
The performance tests were all run on a set of AWS EC2 instances. For each test, the entire environment was reset and rebuilt, and then each test started with some idle cycles to warm up instance caches. Below, you can check the details of the environments used for Jira Service Desk Server and Data Center, as well as the specifications of the EC2 instances.
To run the tests, we used 21 scripted browsers and measured the time taken to perform the actions. Each browser was scripted to perform a random action from a predefined list of actions and immediately move on to the next action (ie. zero think time). Please note that it resulted in each browser performing substantially more tasks than would be possible by a real user, and you should not equate the number of browsers to represent the number of real-world concurrent users.
Each test was run for 40 minutes, after which statistics were collected.
Here are the details of our test environment:
| Jira Service Desk Server | Jira Service Desk Data Center |
|---|---|
The environment consisted of:
| The environment consisted of:
|
| Jira Service Desk for Server | |||
|---|---|---|---|
| Hardware | Software | ||
| EC2 type: |
1 node | Operating system | Ubuntu 16.04 LTS |
| CPU: | Intel Xeon E5-2666 v3 (Haswell) | Java platform | Java 1.8.0 |
| CPU cores: | 36 | Java options | 16 GB heap |
| Memory: | 60 GB | ||
| Disk: | AWS EBS 100 GB gp2 | ||
| Jira Service Desk for DC | |||
|---|---|---|---|
| Hardware | Software | ||
| EC2 type: |
1 node | Operating system | Ubuntu 16.04 LTS |
| CPU: | Intel Xeon Platinum 8000 series (Skylake-SP) | Java platform | Java 1.8.0 |
| CPU cores: | 16 | Java options | 16 GB heap |
| Memory: | 32 GB | ||
| Disk: | AWS EBS 100 GB gp2 | ||
| Database | |||
|---|---|---|---|
| Hardware | Software | ||
| EC2 type: | m4.2xlarge (see EC2 types) | Database: | MySQL 5.5 |
| CPU: | Intel Xeon E5-2666 v3 (Haswell) | Operating system: | Ubuntu 16.04 LTS |
| CPU cores: | 8 | ||
| Memory: | 32 GB | ||
| Disk: | Jira Service Desk Server: Jira Service Desk Data Center: | ||
| Load generator | |||
|---|---|---|---|
| Hardware | Software | ||
| EC2 type: | c4.8xlarge (see EC2 types) | Operating system: | Ubuntu 16.04 LTS |
| CPU: | Intel Xeon E5-2666 v3 (Haswell) | Browser: | Headless Chrome |
| CPU cores: | 36 | Automation script: |
|
| Memory: | 60 GB | ||
| Disk: | AWS EBS 30 GB gp2 | ||
Test environment for indexing measures
| Jira Service Desk for Server | |||
|---|---|---|---|
| Hardware | Software | ||
| EC2 type: |
1 node | Operating system | Ubuntu 16.04 LTS |
| CPU: | Intel Xeon E5-2666 v3 (Haswell) | Java platform | Java 1.8.0 |
| CPU cores: | 36 | Java options | 16 GB heap |
| Memory: | 60 GB | Indexing threads | default (10 on 3.16 and 20 on 4.5) |
| Disk: | AWS EBS 100 GB gp2 | ||
| Database | |||
|---|---|---|---|
| Hardware | Software | ||
| EC2 type: | m4.2xlarge (see EC2 types) | Database: | MySQL 5.5 |
| CPU: | 2.4 GHz Intel Xeon E5-2676 v3 | Operating system: | Ubuntu 16.04 LTS |
| CPU cores: | 8 | ||
| Memory: | 32 GB | ||
| Disk: | Jira Service Desk Server: Jira Service Desk Data Center: | ||