Confluence Data Center load profiles
Understanding the size and shape of your site helps Atlassian Advisory Services and support engineers tailor their configuration and environment recommendations to your current size, and estimate your future growth.
To make determining the size of your site simple, we've developed a set of profiles, ranging from Small to Extra Large, that take into account the amount of content in your instance, and the average amount of traffic your site receives. The profiles are based on averages, collected from a wide range of Server and Data Center customers via case studies and the usage data collected by the Atlassian Analytics app. In future we hope to also use these profiles in our hardware and infrastructure sizing recommendations.
Just like your shoe size won't be the same as your shirt size, your site won't necessarily fit neatly into one profile, for that reason we've broken it into two seperate profiles. For example your site might be Extra Large for traffic and only Medium for the amount of content, or vice versa.
So, let's see how your site sizes up.
Determine your content profile
Confluence sites come in all shapes and sizes, and there are several indicators you can use to assess the relative size of your instance. This is all about the amount of data in your database, which has an impact on how long it takes to execute queries and perform common tasks, such as garbage collection.
To find out the size of your instance:
- Go to Administration menu , then General Configuration > System Information.
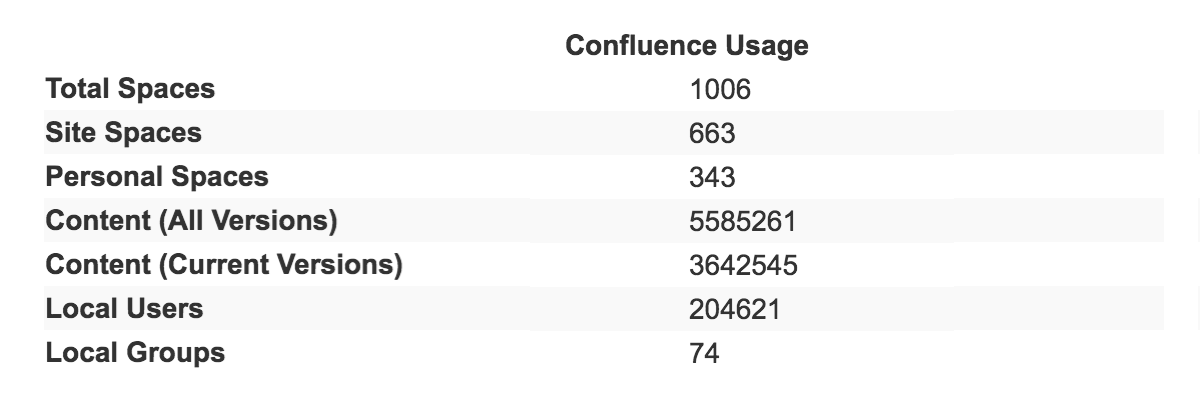
- Scroll down to Confluence Usage.
- Make a note of:
- Total spaces: covers all content in your site such as pages, blog posts, files, comments, and includes the version history of versioned items.
- Content (All Versions): includes all site and personal spaces
- Local Users: includes all user accounts from local and remote directories that are synced to the database.
Once you have your Confluence usage figures, use the table below to see where your site fits.
| Content (all versions) | Total spaces | Local users | |
|---|---|---|---|
| S | up to 500,000 | up to 1,000 | up to 1,000 |
| M | 500,000 to 2.5 million | 1,000 to 2,500 | 1,000 to 10,000 |
| L | 2.5 million to 10 million | 2,500 to 5,000 | 10,000 to 100,000 |
| XL | 10 million to 25 million | 5,000 to 50,000 | 100,000 to 250,000 |
Determine your traffic profile
This is about gauging the amount of load your site experiences in any given hour. While there are many ways to measure this, we've found that HTTP calls to the application server (Tomcat) is a metric that is relatively easy to measure, and indicative of load.
To determine your traffic profile, you'll need to use an external monitoring tool. See Tools for monitoring your Data Center application for information on some third party applications that will help you do this. It's important to note that the monitoring tool shouldn't run on the same nodes as your Data Center application, as it could affect the overall performance of your site.
Once you've measured your average HTTP calls per hour, use the table below to see where your site fits.
| HTTP calls per hour | |
|---|---|
| S | up to 70,000 p/h |
| M | 70,000 to 350,000 |
| L | 350,000 to 700,000 p/h |
| XL | 700,000 to 1,000,000 p/h |
Remember, your traffic profile may be very different to your content profile. They don't need to match.
How to use this information
You may want to share your content and traffic profiles with your Advisory Services if you have one, or with your support engineer the next time you need to open a ticket relating to performance, stability, or infrastructure generally.
In the examples above, our site would be classified as Large for data, and Medium for traffic.
You can also use these profiles as a point-in-time snapshot, to track the relative size of your instance over time. Stepping up into the next content or traffic profile is often a sign that it's time to evaluate your current infrastructure, and decide how you'll scale to meet the increased load.
Large and XLarge deployments
If your current or projected load profile is sized Large or XLarge, read through our Infrastructure recommendations for enterprise-scale Confluence instances. Here, we provide recommendations for deploying appropriately-sized infrastructure on AWS. That page also explains the test methodology and results that form the basis of those recommendations.
Help us help you
Collecting usage data allows us to measure the user experience across many thousands of users and deliver features and improvements that matter. It also helps us create the average profiles, like the ones on this page, that can be used to provide better configuration and environment recommendations.
If your site doesn't currently send analytics data to us, check out our Data Collection Policy to find out about what we collect, how it's sent to us, and how you can opt-in.


