![]() Documentation for GreenHopper 6.2.x. Documentation for other versions of JIRA Agile is available too.
Documentation for GreenHopper 6.2.x. Documentation for other versions of JIRA Agile is available too.
GreenHopper is now called JIRA Agile. Learn more![]() .
.
The GreenHopper Classic Chart Board provides you with a graphical representation of the progress of ongoing versions. You can view 'burndown' graphs that show the number of incomplete issues that need to be addressed or hours remaining to complete work for a specified version, over the duration of that version. You can also view 'burnup' graphs to show other custom data associated with issues, such as business value.
All graphs can show a range of additional trend lines to help you monitor and manage the progress of work conducted in your team.
To view the hour burndown chart for your project version,
- Log into JIRA.
- Select Agile > Classic in the top navigation bar. Then select Classic Chart Board from the drop-down below the project name.
- Select your project from the project dropdown (top left of the Chart Board above the 'Chart Board' dropdown), if it is not already selected. The Chart Board will refresh with information for your project.
Tip: You can configure your Chart Board context and user preferences to personalise your Chart Board.
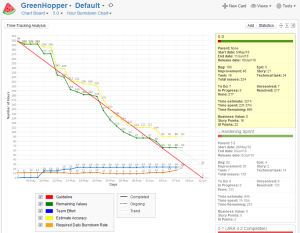
Screenshot: GreenHopperClassic Chart Board (click to view larger image)
The screenshot above shows an example Chart Board. To learn more about how to use the Chart Board, please see the sections below and the documentation linked from those sections.
Classic Chart Board — Navigation Bar

- Project dropdown — Select the project whose charts you wish to view.
- Context dropdown — Select the context by which to filter issues whose data will be represented in the charts ('Default', 'On the fly', or other contexts you have created). You can also select Manage to edit your existing contexts, or New to create a new context. Read more about contexts in Using Contexts to Filter and Highlight Issues.
- Refresh icon — Click the icon to reload the contents of the Chart Board.
- Board dropdown — Select another Classic board to view (Planning Board, Task Board or Released Board).
- Version dropdown — Select the version for the Chart Board.
- Chart type dropdown— Select the type of chart you wish to view:
- Hour Burndown Chart — Displays a chart depicting the number of hours remaining until the version release date.
- Issue Burndown Chart — Displays a chart depicting the number of issues remaining until the version release date.
- Burndown Chart — Displays a chart depicting a custom field's number of units (for example, story points) remaining until the version release date.
- Burnup Chart — Displays a chart depicting a custom field's number of units (for example, business value) being gained in the lead-up to the version release date.
- Value Chart — Displays a chart depicting a custom field's number of units being either burned (for example, 'story points') or gained (for example, 'business value') in the lead-up to the version release date.
- Cumulative Flow — Displays the Cumulative Flow Diagram for a version.
- Custom field and Daily/By Children dropdowns — These options only appear if you have chosen to view the Burndown Chart, Burnup Chart or Value Chart only. Please refer to these topics for details on this dropdown.
- New Card — Click the New link to create a new card (i.e. issue). For details see Creating an Issue in GreenHopper Classic.
- Views dropdown — Select from the following:
- Full Screen — Hides the JIRA header so as to fit more cards on the screen.
- Tools dropdown — Select from the following:
- User Preferences — Displays your user preferences for editing. Read more in Managing your User Preferences.
- Configuration (Visible to administrators only) — Opens the Project Configuration screen. Read more in Configuring your GreenHopper Project Settings.
Classic Chart Board - Displayed Chart
The actual display will depend on which chart you have selected. See:
- Viewing the Cumulative Flow Chart on the Chart Board
- Viewing the Hour Burndown Chart
- Viewing the Issue Burndown Chart
- Viewing the Statistics Burndown Chart
- Viewing the Statistics Burnup Chart
- Viewing the Value Chart
- Showing Chart Information By Team
Classic Chart Board — Statistics Column
To select a box, click inside it and once selected, the box turns yellow. The content on the rest of the Board you are viewing will be updated to show the data associated with that box.
You may need to refresh the contents of the chart board first in order to see this menu option.
If the version contains unfinished issues, you will be prompted to either ignore them and proceed with the release, or move the unfinished issues to another version of your choice.
Tip: The start date and end date are used to compute the various Classic charts.
Tip: Boxes that relate to child versions or components are attached below their parent version or component and are represented with a right-indented arrow, as shown by the 'Hardening Sprint' example in the screenshot above.


