How to set up triggers to get diagnostic information from a Java application
Platform notice: Server and Data Center only. This article only applies to Atlassian products on the Server and Data Center platforms.
Support for Server* products ended on February 15th 2024. If you are running a Server product, you can visit the Atlassian Server end of support announcement to review your migration options.
*Except Fisheye and Crucible
This guide provides a basic introduction on how to use the JDK Mission Control tool and is provided as-is. Our support team can help you troubleshoot a specific Confluence problem, but aren't able to help you set up your monitoring system or interpret the results.
Summary
Getting diagnostic information on the correct moment is crucial for investigating specific types of issues. Performance-related problems are the most common example, data from the incident window is needed to determine what caused it.
Solution
It is possible to set up triggers to generate this type of data (thread dumps, heap dump, or a Java Flight Recording) using a tool called JDK mission control.
The guide below covers how to set such triggers and what is the action taken:
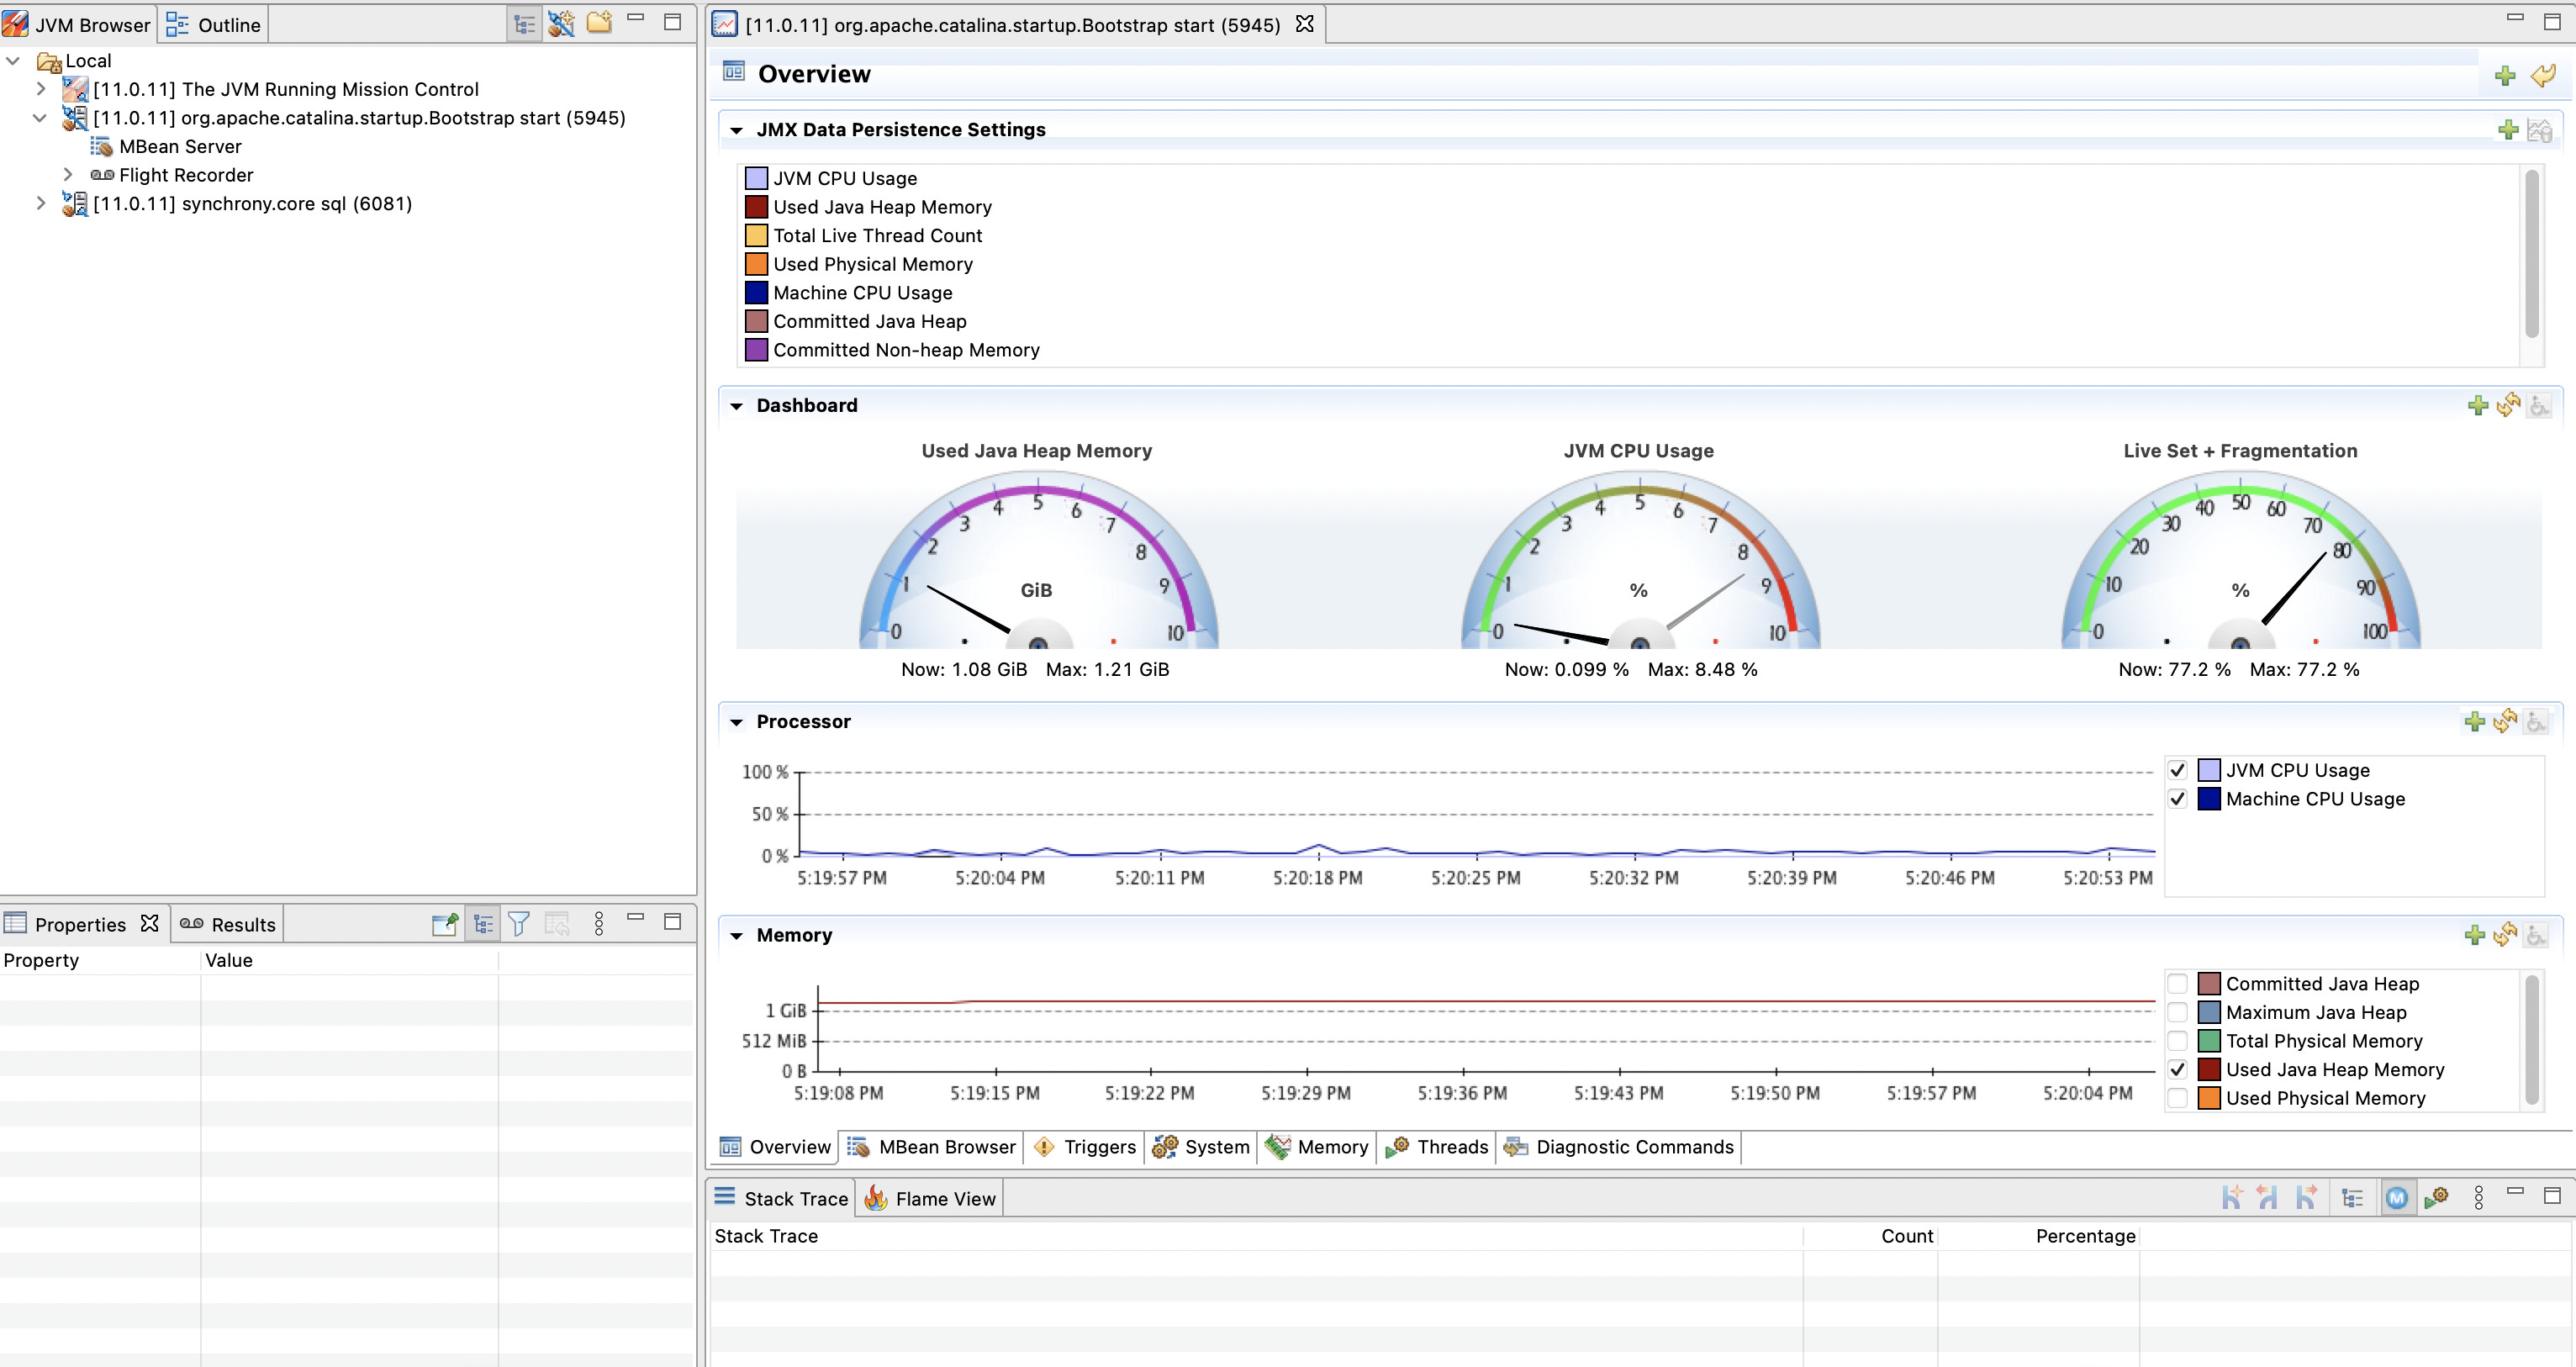
Since Mission Control connects through the JMX interface, it also offers live monitoring capabilities, including CPU usage, memory, and thread activity. It is possible to configure different MBeans to track the application health besides the default ones on the dashboard:
For more details, check the documentation below:
