Administer analytics
This page is not about the analytics data which is sent to Atlassian to help us improve the product. See Data Collection Policy to find out what is collected, and how you can opt in or out of this data collection.
Disable analytics
If you don't want Confluence to collect user activity and page view data, you can disable the system app that provides the Analytics feature.
To disable analytics:
- Go to Administration > Manage apps.
- Search for Analytics for Confluence.
- Expand the listing then select Disable.
Disabling the system app won't remove any existing analytics data from your database, but will stop Confluence collecting data.
Permissions
By default, all logged in users can view the Analytics option in the header, and access analytics data for spaces they have permissions to see. Anonymous users can't view analytics.
Limit who can view analytics reports
If you don't want everyone to be able to view analytics, you can chose to limit access to specific groups.
To limit analytics to specific groups:
- Go to Administration > General Configuration > Analytics Permissions.
- Search for a group.
- Select Add.
- Repeat this process for each group.
Only people who are a member of these groups will see the Analytics option in the header, or in a space.
To revert to the default, and allow all users to view analytics:
- Go to Administration > General Configuration > Analytics Permissions.
- Remove all groups from the list.
You don't need to add every group individually to give everyone access.
Limit who can view analytics reports for specific spaces
To change who can see analytics reports in a space:
- Go to the space and select Space tools > Permissions from the bottom of the sidebar.
- Select the Analytics Permissions tab.
- Select Viewing Analytics Restricted from the drop down.
- Enter the users and/or groups you want to allow to view analytics reports.
- Save your changes.
Good to know:
- If a Confluence administrator has denied a group permission to view analytics, adding the group at the space level will not grant this permission.
- The space will still appear in the site analytics report (if the user has permission to see the space, and use analytics globally), but they will be prevented from viewing the space analytics report if they don't have space permissions.
Data retention
If you have a very big, busy site, the amount of data collected can have an impact on your database size and general site performance. To avoid any problems, you can choose how long to retain events for, and change the maximum number of events that can be stored at any time.
If you have a very large, active site, we recommend keeping the data retention settings quite low, and using rate limiting.
Set a data retention period
By default we store analytics events in the database for 12 months. You can reduce or increase this limit if you have different requirements. A long retention period can affect the size and performance of your database, so if you have a big, busy site you may need to choose a shorter retention period.
To change the data retention period:
- Go to Administration > Manage apps.
- Search for Analytics for Confluence.
- Expand the listing then select Configure.
- Under Data Retention Period, select Edit.
- Choose either 6, 12, 18, or 24 months.
- Save your changes.
Your change will take effect after 24 hours. This is to prevent data being immediately deleted if you accidentally choose the wrong retention period.
Confluence regularly deletes any events older than the chosen retention period (every 60 seconds). Note that the event retention limit also applies, so events exceeding the maximum number of events will be deleted, regardless of whether they fall within the data retention period.
Set an event retention limit
By default, we store a maximum of 20,000,000 analytics events in the database. This is to ensure analytics queries are reasonably performant in all databases. You can choose to further reduce this limit.
To change the maximum number of events to retain:
- Go to Administration > Manage apps.
- Search for Analytics for Confluence.
- Expand the listing then select Configure.
- Under Event retention, select Edit.
- Enter the maximum number of events.
- Save your changes.
Confluence regularly deletes any events exceeding limit (every 60 seconds), starting with the oldest events.
We don't recommend increasing this limit beyond 20 million events, as this will result in very large database tables, and eventually cause performance issues.
Rate limiting
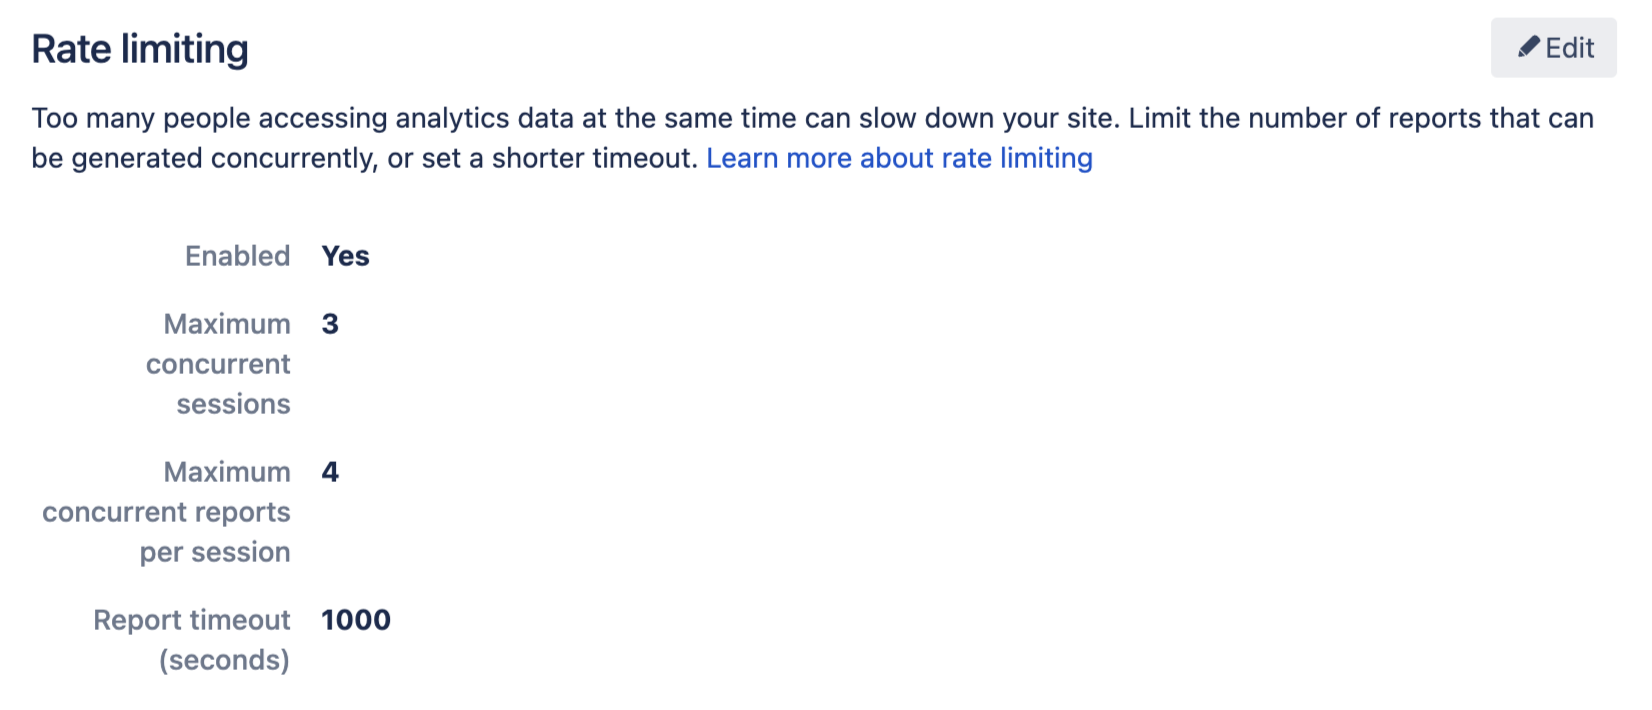
Too many people accessing analytics data at the same time can slow down your site. To avoid performance bottlenecks:
You can limit the number of concurrent sessions across your instance. This helps you control the number of analytics sessions that are open across your site.
You can limit the number of concurrent reports per session. This allows you to set the number of reports that can be generated at the same time in a session.
You can set a timeout for reports that are taking too long to load. This helps you manage overall site performance.
Screenshot: Configure rate limiting for analytics in the admin console.
To change the maximum number of concurrent sessions, or concurrent reports per session:
- Go to Administration > General Configuration.
In the menu items (left panel), find the Confluence Analytics section, then select Configuration.
Next to Rate limiting, select Edit.
Enter the maximum number of current sessions.
Enter the maximum number of concurrent reports per session.
Select Save.
If someone tries to view an analytics report, and the limit has been reached, they'll see a message to try again in a few minutes.
To change the timeout:
- Go to Administration > General Configuration.
In the menu items (left panel), find the Confluence Analytics section, then select Configuration.
Next to Rate limiting, select Edit.
Enter the new timeout value in seconds.
Select Save.
If someone tries to view a report that can't be loaded within the time limit, they'll see a timeout error. When this happens, the best option is to change the report filters, such as reducing the date range.
Increased privacy mode
Privacy requirements can differ greatly between organisations and between different jurisdictions. In some circumstances it will not be appropriate for people to see the names of users who have viewed content in your site, or for you to be collecting this data in an identifiable format.
Turn on Increased privacy mode to minimise the amount of personally identifiable information (PII) that is collected and displayed to users.
To turn on increased privacy mode:
- Go to Administration > Manage apps.
- Search for Analytics for Confluence.
- Expand the listing then select Configure.
- Under Increased Privacy Mode, select Edit.
- Select the Enabled toggle.
- Save your changes.
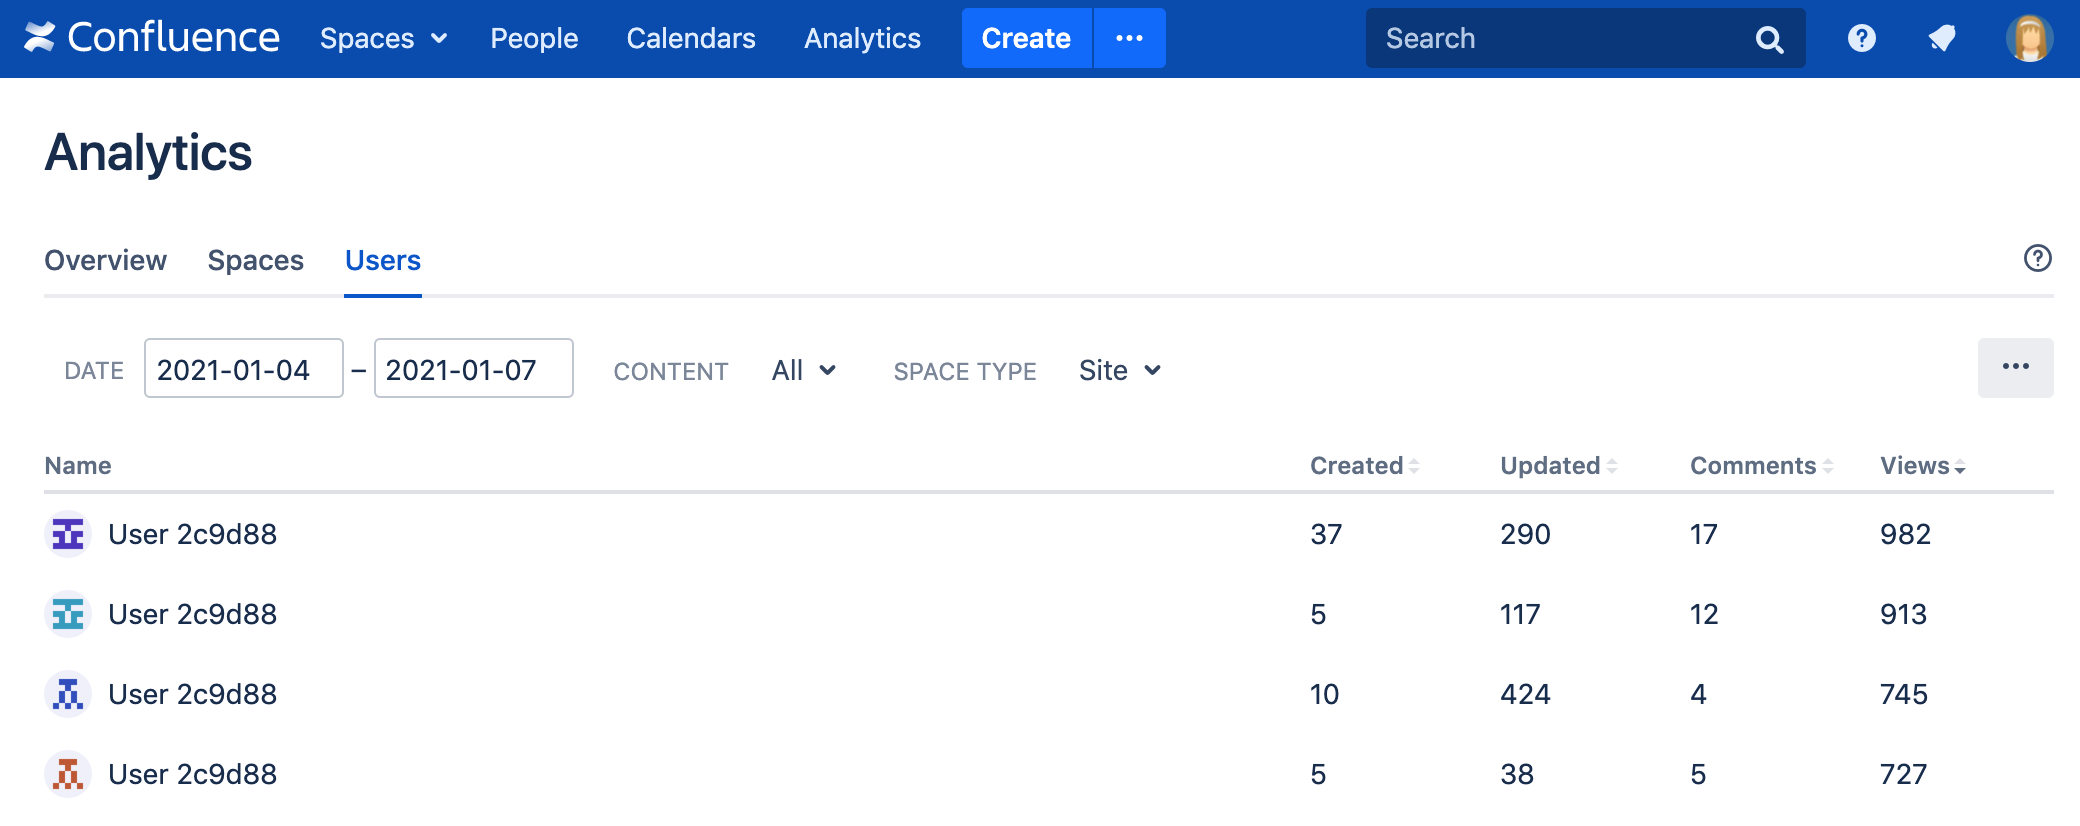
From this point onwards, space or page activity is no longer linked to individuals, but instead attributed to an anonymised user. In analytics reports, people will be represented as "User 12345" with an anonymised avatar. This means you still get an accurate picture of the engagement with your content, but without revealing user information.
It is very important to note that changing this setting does not affect any previously collected data. This means:
- You may need to manually remove any previously collected data after turning on increased privacy mode.
- Unique user counts will be temporarily inaccurate, as we do not attempt to connect a named user with their anonymised alias, so unless you have manually removed the named user data, both will exist for a time.
Screenshot: the site analytics users tab, with increase privacy mode turned on.
Known issues
There are some known issues with analytics that you should be aware of.
Site analytics reports may take a long time to load
There are a few situations where the site analytics reports (accessed from Analytics in the header) take longer than expected to load, including:
- if your spaces have complex permissions, or most spaces in your site are restricted
- if you're running Confluence on MySQL.
Some reports show data for deleted content
Some analytics reports continue to show aggregate data for content or user accounts that have subsequently been deleted.
Comments column always shows data for pages and blogs
In the Users tab of any analytics report, the comments column always lists the total number of comments on pages and blog posts, regardless of whether the content filter is set to just pages, or just blog posts.

