Monitor Confluence with Prometheus and Grafana
This page will guide you through how to install and connect Prometheus and Grafana. This is optional, but may be useful if you don't already have an APM, or would like to use our templates and sample queries.
Prerequisite
To monitor Confluence in Prometheus or Grafana, you'll need to install a JMX exporter to transform theJMX MBeans into the right format for your tool. See Monitor application performance to find out how to do this.
Use Prometheus to monitor app performance metrics
To set up Prometheus to monitor app metrics:
Download and install Prometheus.
For installation options and detailed instructions see the Prometheus documentation.Edit the prometheus.yaml file and add the following scrape configuration to the bottom of the file.
# A scrape configuration containing exactly one endpoint to scrape:
scrape_configs:
  - job_name: 'Confluence app metrics'
    scheme: http
    metrics_path: '/metrics'
    static_configs:
     - targets: ["<jmx-exporter-host>:<port>"]
The target is the JMX exporter, not Jira. For example - targets: ["localhost:8060"]
If you deploy Prometheus in Kubernetes, you'll need to use a pipe to indicate the multi-line YAML string, as in the example below.
extraScrapeConfigs: |
  - job_name: 'Confluence app metrics'
    scheme: http
    metrics_path: '/metrics'
    static_configs:
     - targets: ["10.23.45.678:8080"]
See Configuration in the Prometheus documentation for more configuration options.
Start Prometheus. How you do this will depend on the way you run Prometheus.
Access the Prometheus UI at
http://localhost:9090/.Go to Status > Targets to check that Prometheus is successfully connected to the JMX exporter.
Perform a simple query
You can confirm that Prometheus is receiving app metrics with a simple test.
Go to Administration > Manage apps and temporarily disable an app (such as the Confluence Migration Assistant, don't disable anything that will interrupt your users).
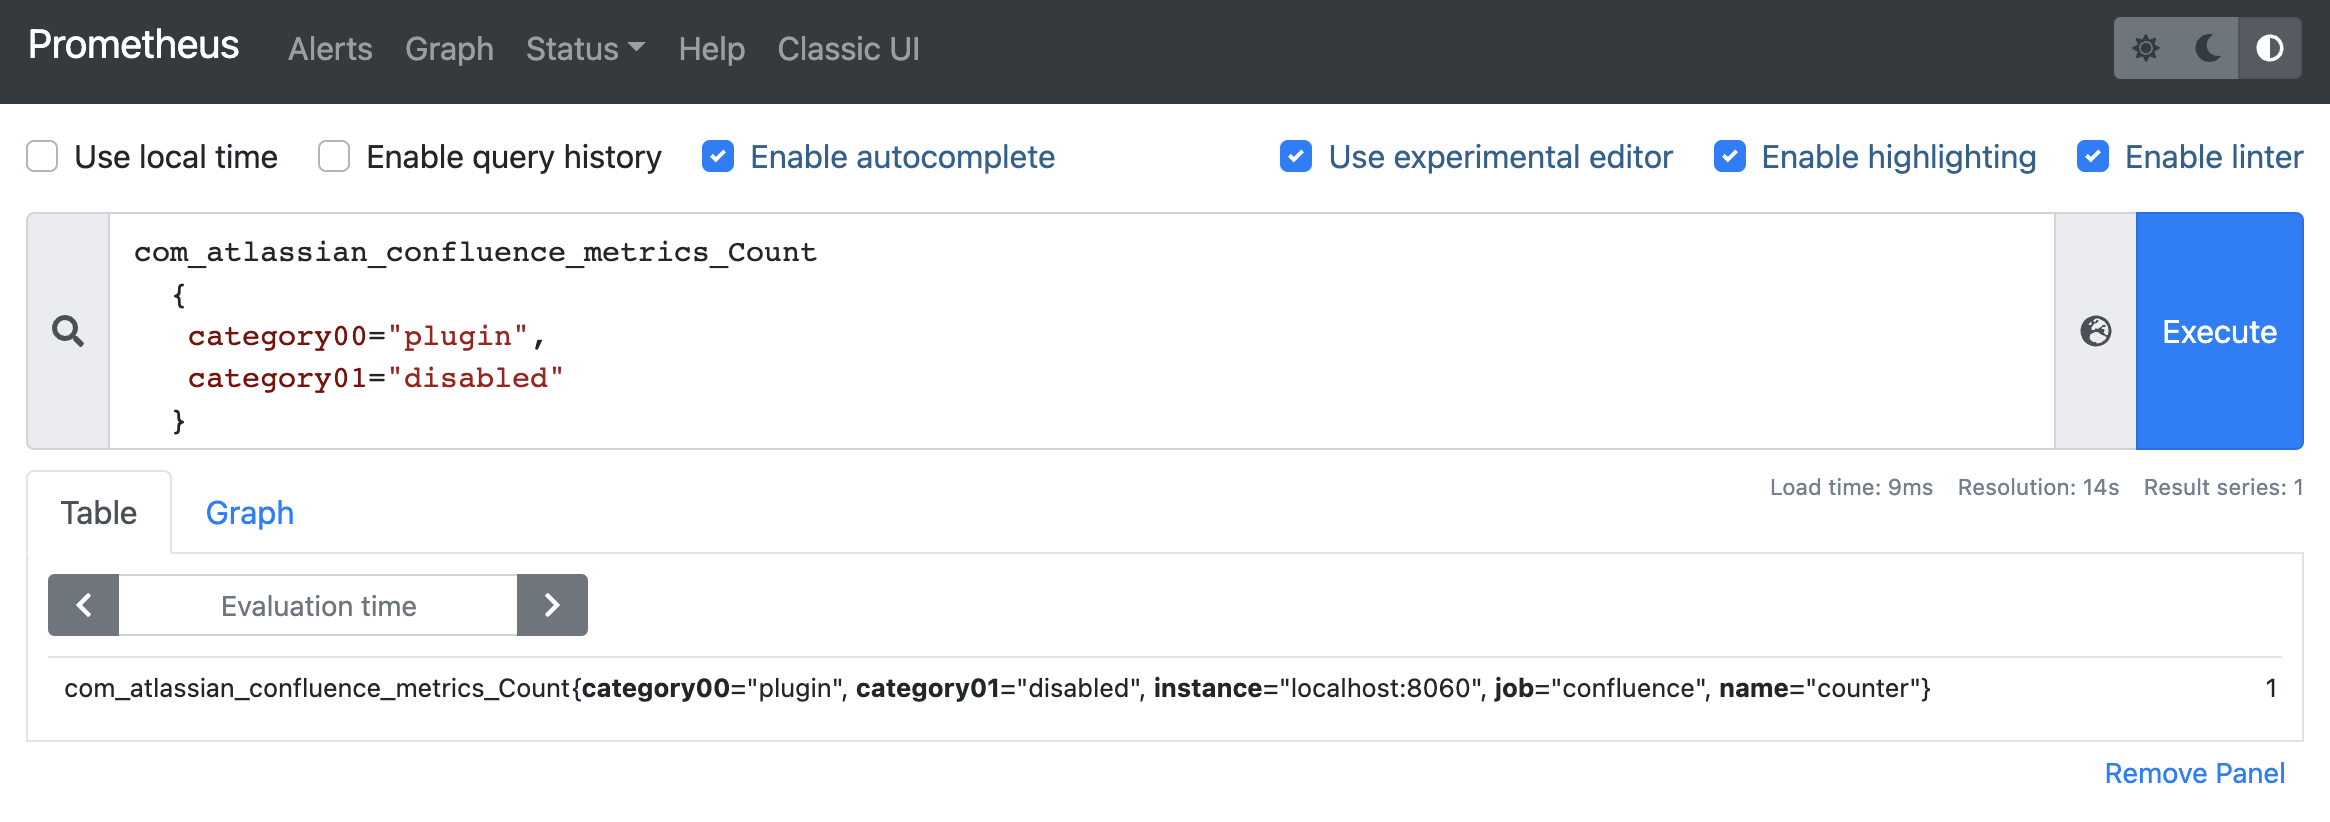
In Prometheus, run the following query:
com_atlassian_confluence_metrics_Count
  {
   category00="plugin",
   category01="disabled"
  }
This will return the number of times an app has been disabled since monitoring was turned on.
Use Grafana to visualize metrics
While you can use Prometheus to create graphs of your data, if you want to take it to the next level, you can use a tool like Grafana to create more detailed charts and dashboards.
To get you started, we've created some sample dashboards which tracks several important metrics. You can access the JSON for these dashboards in our App monitoring dashboards repository.
To set up Grafana and import the sample dashboard:
Download and install Grafana.
For installation options and detailed instructions see the Grafana documentation.Create a Prometheus data source in Grafana.
For detailed instructions see the Prometheus documentation.Select Create (+) > Import.
Paste the JSON sample provided in the repository into the Import via panel json field. Remember to update the Unique identifier (only required if you already have a dashboard with the same ID).
Select Load.
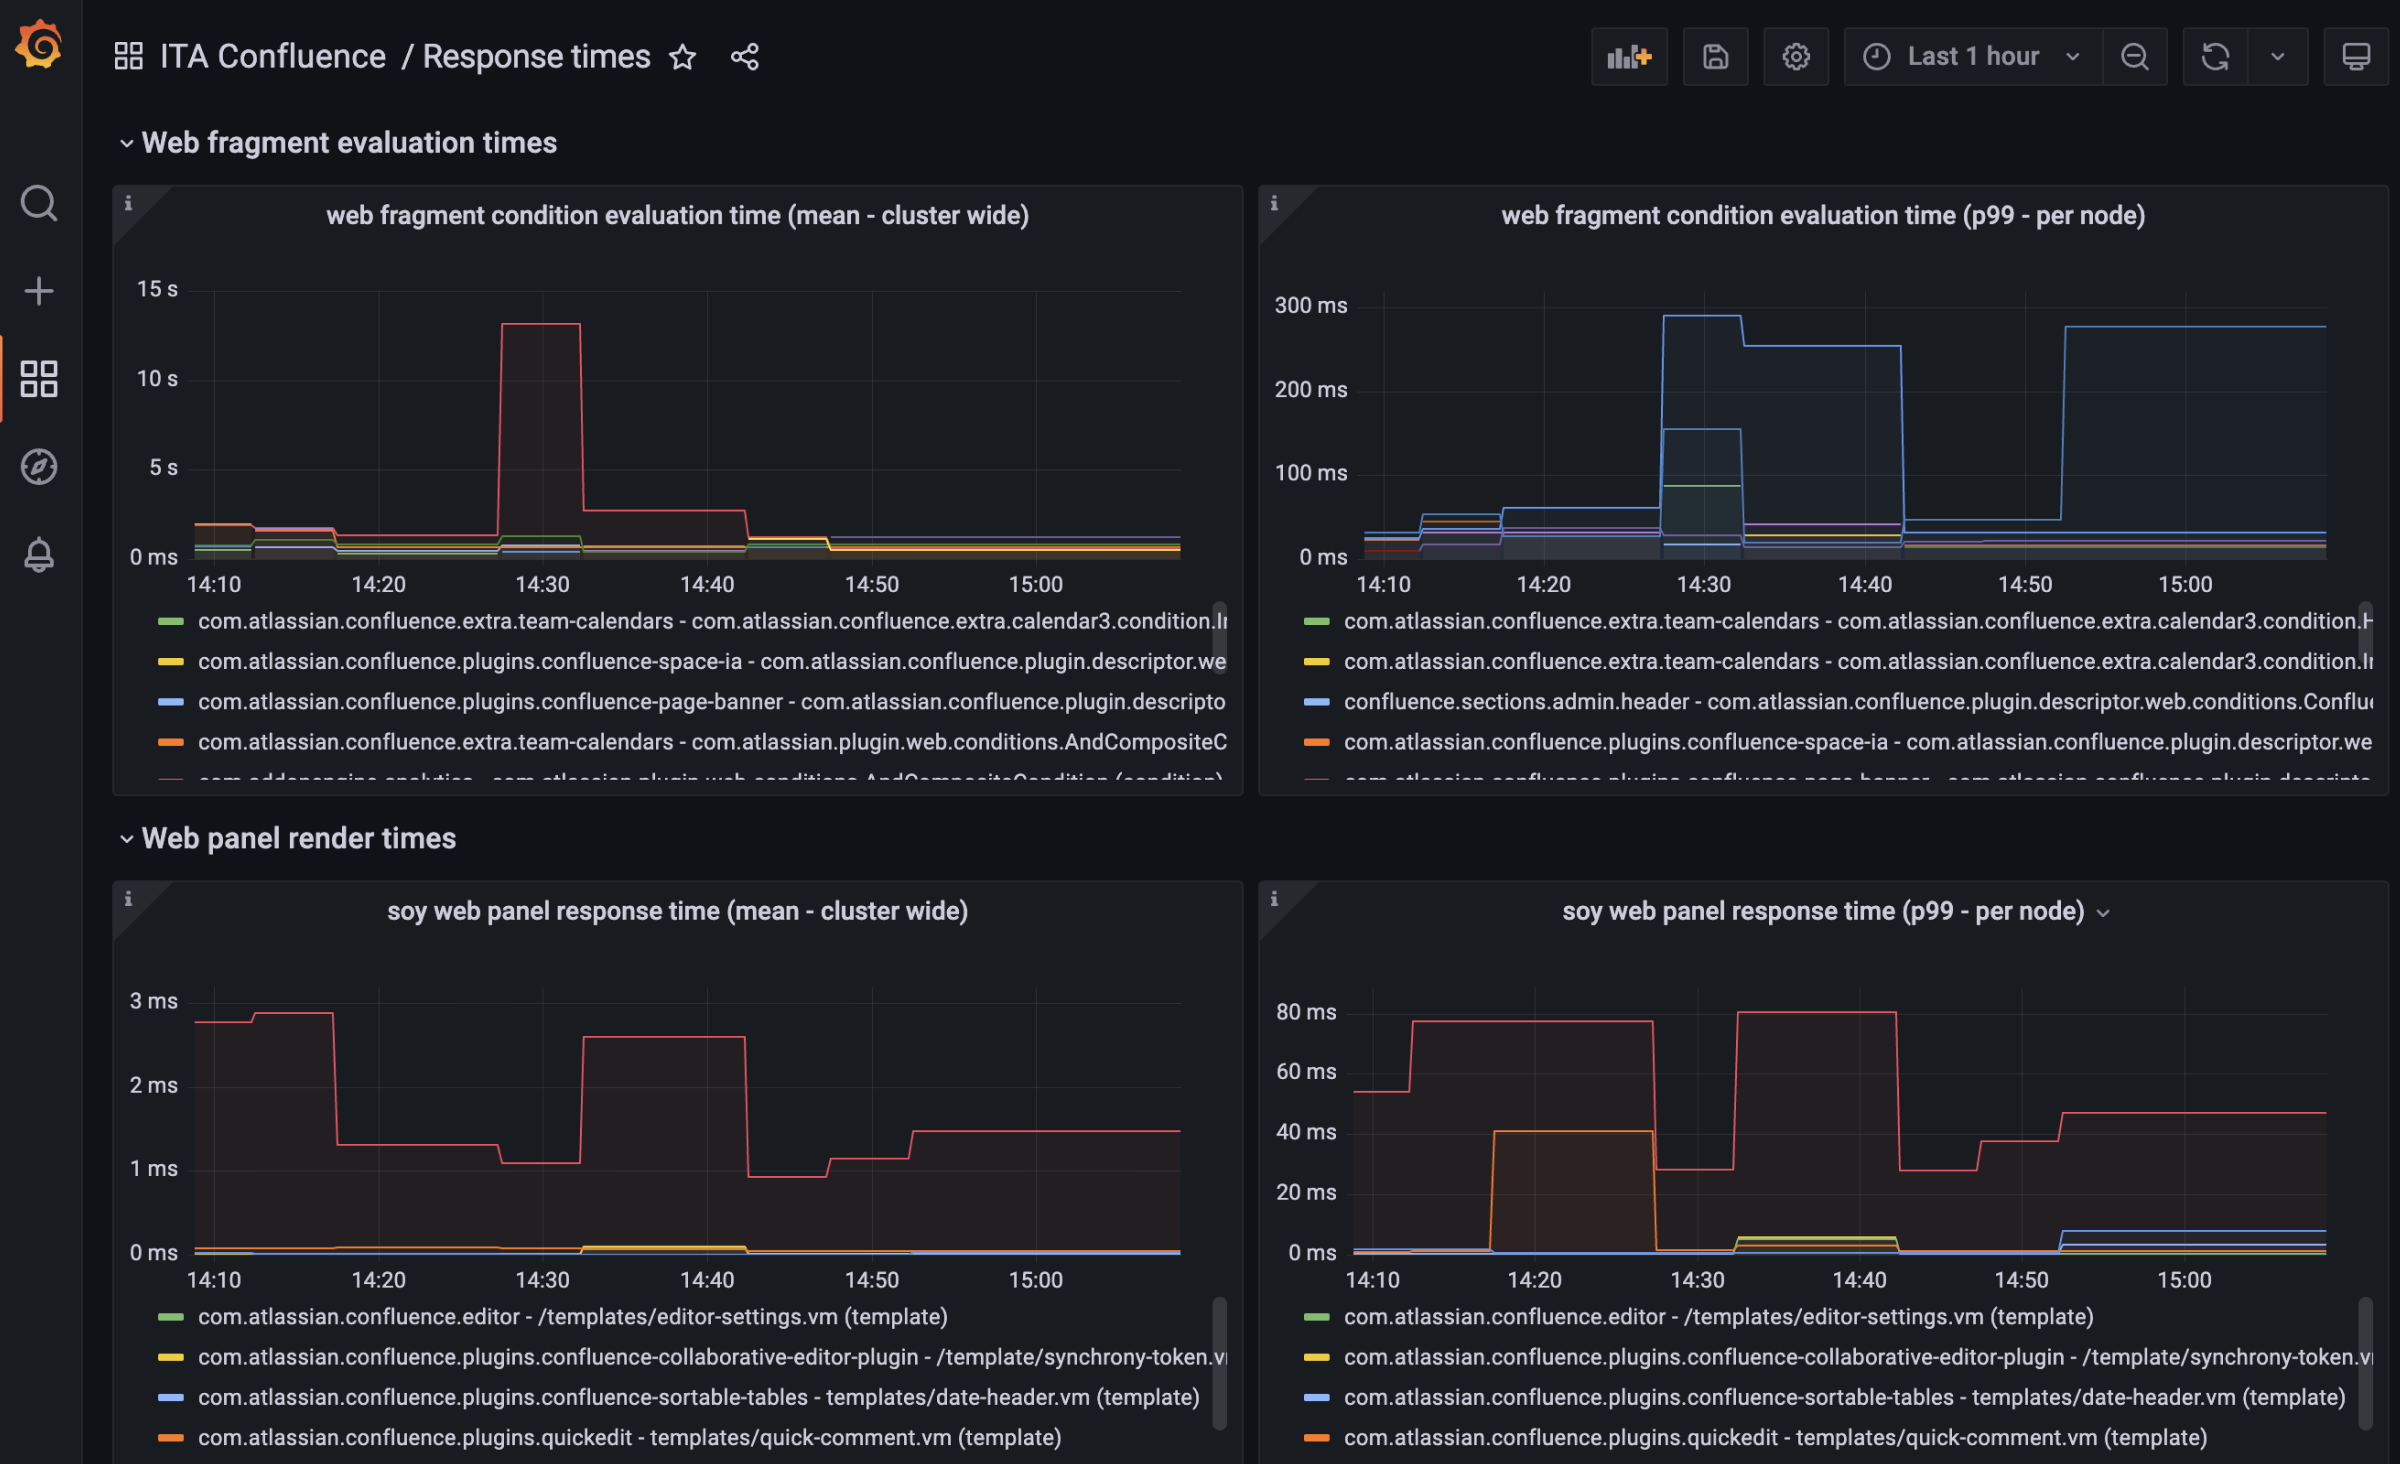
Here's an example of a dashboard in Grafana showing response times for various plugins.

