Requesting Performance Support
Basic performance troubleshooting steps
Begin with the following procedures:
- Go through the Troubleshooting Confluence hanging or crashing page to identify the major known performance problems.
- Proceed with the Performance Tuning tips to help optimise performance.
Requesting basic performance support
If the above tips don't help or you're not sure where to start, open a support ticket starting with at least the basic information:
- The atlassian-confluence.log
- The
catalina.outlog (or your application server log), with a series of three thread dumps separated by 10 seconds - A description with as much detail as possible regarding:
- What changes have been made to the system?
- When did performance problems begin?
- When in the day do performance issues occur?
- What pages or operations experience performance issues?
- Is there a pattern?
Continue with as much of the advanced performance troubleshooting information as you can.
Advanced performance troubleshooting
Please gather all of the information listed below and include it in your support request, even if you think you have a good idea what's causing the problem. That way we don't have to ask for it later.
System information
Confluence server
- Take a screenshot of Confluence's
Administration → System Information(or save the page as HTML) - Take a screenshot of Confluence's
Administration → Cache Statistics(or save the page as HTML) - Find out the exact hardware Confluence is running on
- How many CPUs? What make and model? What MHz?
- How much memory is installed on the machine?
- How much memory is assigned to Confluence's JVM? (i.e. what are the -Xmx and -Xms settings for the JVM?)
- What other applications are being hosted on the same box?
Confluence content
- How many users are registered in Confluence?
- On average, to how many groups does each user belong?
- How many spaces (global and personal) are there in your Confluence server?
- How many of those spaces would be viewable by the average user?
- Approximately how many pages? (Connect to your database and perform '
select count(*) from content where prevver is null and contenttype = 'PAGE'') - How much data is being stored in Bandana (where plugins usually store data)? (Connect to your database and perform '
select count(*), sum(length(bandanavalue)) from bandana')
The database
- What is the exact version number of Confluence's database server?
- What is the exact version number of the JDBC drivers being used to access it? (For some databases, the full filename of the driver JAR file will suffice)
- Is the database being hosted on the same server as Confluence?
- If it is on a different server, what is the network latency between Confluence and the database?
- What are the database connection details? How big is the connection pool? If you are using the standard configuration this information will be in your confluence_cfg.xml file. Collect this file. If you are using a Data source this information will be stored in your application server's configuration file, collect this data.
User management
- Are you using external user management or authentication? (i.e. JIRA or LDAP user delegation, or single sign-on)
- If you are using external JIRA user management, what is the latency between Confluence and JIRA's database server?
- If you are using LDAP user management:
- What version of which LDAP server are you using?
- What is the latency between Confluence and the LDAP server?
Diagnostics
Observed problems
- Which pages are slow to load?
- If it is a specific wiki page, attach the wiki source-code for that page
- Are they always slow to load, or is the slowness intermittent?
Monitoring data
Before drilling down into individual problems, helps a lot to understand the nature of the performance problem. Do we deal with sudden spikes of load, or is it a slowly growing load, or maybe a load that follows a certain pattern (daily, weekly, maybe even monthly) that only on certain occasions exceeds critical thresholds? It helps a lot to have access to continuous monitoring data available to get a rough overview.
Here are sample graphs from the confluence.atlassian.com system, showing
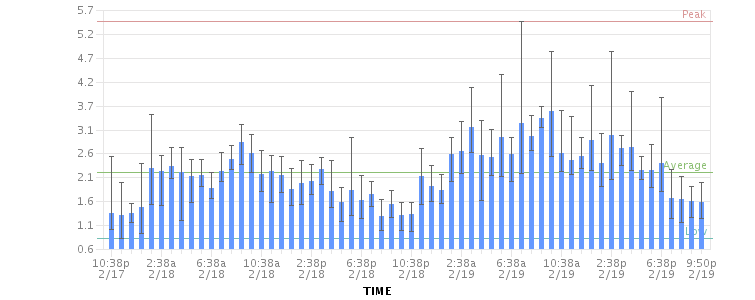
Load
This graph shows the load for two consecutive days. The obvious pattern is that the machine is under decent load, which corresponds to the user activity, and there is no major problem.
Resin threads and database connections
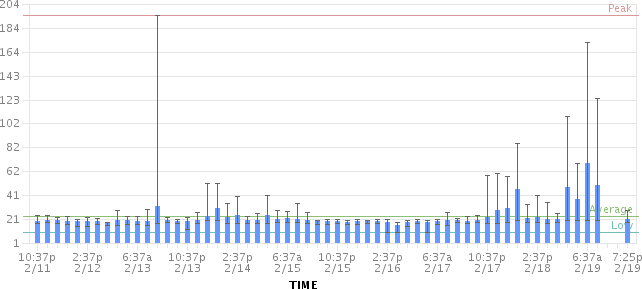
Active number of Java Threads
These two charts show the active threads in the application server (first chart) and the size database connection pool (second chart). As you can see, there was a sudden spike of server threads and a corresponding spike of db-connections.
The database connection pool size
The database connection pool size peaked over 112, which happened to be more than the maximum number of connections the database was configured for (100). So it was no surprise that some requests to Confluence failed and many users thought it had crashed, since many requests could not obtain the crucial database connections.
We were able to identify this configuration problem quite easily just by looking at those charts. The next spikes were uncritical because more database connections were enabled.
The bottom line being: it helps a lot to monitor your Confluence systems continuously (we use Hyperic, for example), and it helps even more if you are able to send us graphs when you encounter problems.
Access logs
- How to Enable User Access Logging, including redirecting the logs to a separate file
- You can run this file through a log file analyser such as AWStats, or manually look through for pages which are slow to load.
Profiling and logs
- Enable Confluence's built-in profiling for long enough to demonstrate the performance problem using Troubleshooting Slow Performance Using Page Request Profiling.
- If a single page is reliably slow, you should make several requests to that page
- If the performance problem is intermittent, or is just a general slowness, leave profiling enabled for thirty minutes to an hour to get a good sample of profiling times
- Find Confluence's standard output logs (which will include the profiling data above). Take a zip of the entire logs directory.
- Take a thread dump during times of poor performance
CPU load
- If you are experiencing high CPU load, please install the YourKit profile and attach two profiler dumps taken during a CPU spike. If the CPU spikes are long enough, please take the profiles 30-60 seconds apart. The most common cause for CPU spikes is a virtual machine operating system.
- If the CPU is spiking to 100%, try Live Monitoring Using the JMX Interface, in particular with the Top threads plugin.
Site metrics and scripts
- It is essential to understand the user access and usage of your instance. Please use the access log scripts and sql scripts to generate Usage statistics for your instance.
Next step
Open a ticket on https://support.atlassian.com and attach all the data you have collected. This should give us the information we need to track down the source of your performance problems and suggest a solution. Please follow the progress of your enquiry on the support ticket you have created.


