3. Exploration of test results in Eclipse
Test Run Explorer
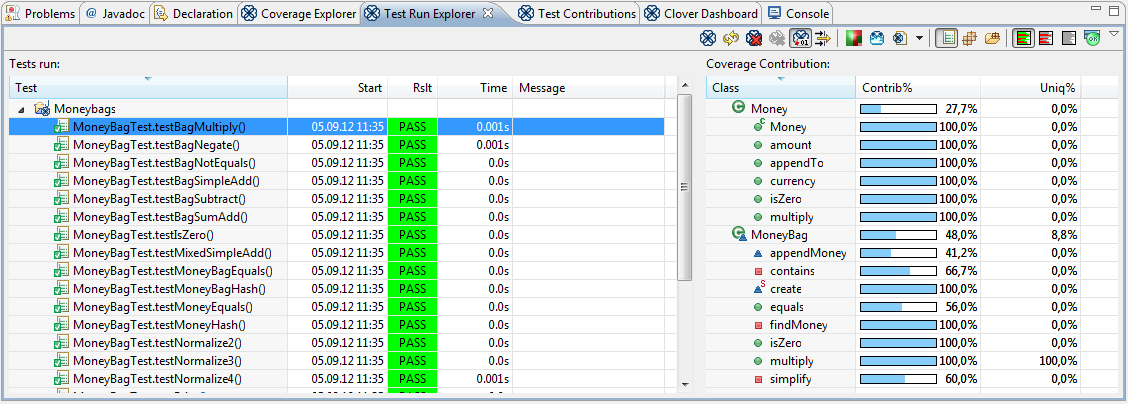
The Test Run Explorer view, like several popular plugins such as the JUnit Plugin or TestNG Plugin, lets you explore your recently run tests - showing whether they passed or failed, their duration and any error messages that they generated. Clover-for-Eclipse takes this one step further and allows you to explore the code coverage caused by an individual test, a test class, a package or even your entire project.
After running tests in a Clover-enabled project, select the Test Run Explorer view (or to open it, select Window > Show Views > Other... > Clover > Test Run Explorer). On the left-hand side of this view you will see a tree of tests that were run and their containers such as classes, packages, projects. On selecting an element on the left-hand side, the right-hand side displays all the application (i.e. non-test) classes that had coverage caused by the selection.
For example, selecting a test method on the left side will cause the right-hand side to show the application classes with code executed (directly or indirectly) by that test method. Selecting a test class or test package will cause the right-hand side to show application classes with code executed by all the test methods contained by the test classes or test package.
The right-hand table displays not only the names of the classes that were partially or fully covered by the test methods, but also the percentage of class' total coverage that is attributable to the test method (the test method's coverage contribution) as well as the percentage of the class' coverage that was attributable only to the selected test method (the test method's unique coverage).
The tree of tests and their containers on the left-hand tree can be presented in three different ways for maximum convenience:
Test Cases: shows "Project > Test Methods" (qualified with Test Class names)
- Packages : shows "Project > Package > Test Class > Test Methods" layout
- Source Roots: shows "Project > Source Root > Package > Test Class > Test Methods" layout
Actions and Menus
The Test Run Explorer view allows the following actions (from the view toolbar, menu or both):
- Enable/Disable Clover On... Allows you to select multiple project to enable or disable Clover for. This allows you, for example, to quickly turn Clover on for all projects in your workspace in one action.
- Refresh Coverage Data. Re-loads from disk the Clover coverage data for the selected project.
- Delete Coverage Recordings. Deletes the coverage recording data recorded from test runs or applications runs for the selected project.
- Clear Snapshot Deletes the Test Optimization snapshot file
- Compiled with Clover. Toggles the use of Clover instrumentation when Eclipse compiles the selected Java project.
- Edit Context Filter... Allows you to edit the block and custom coverage 'contexts' used to help you filter out unwanted coverage data. An explanation of what contexts are can be found here.
- Generate Coverage Treemap. Generates a mini report page in treemap format for the selected project. This report arranges package and classes enabling easy comparison of their complexity while also indicating their level of code coverage.
- Generate Coverage Cloud. Generates a report page in cloud tag format for the selected project. This lists classes considered project risks or quick wins.
- Coverage Reports > Run new report... Launches the report generation wizard that will take you through the steps required to generate a PDF, HTML or XML. These reports can be generated for single or multiple projects.
- Coverage Reports > View report Browse recently generated reports.
- Layout > Test cases Shows "Project > Test Methods" layout
- Layout > Packages Shows "Project > Package > Test Class > Test Methods" layout
- Layout > Source roots Shows "Project > Source Root > Package > Test Class > Test Methods" layout
- Coverage in Editors > Show All. Shows red/green coverage areas in open Java editors. This is useful for finding out exactly which parts of the code are being covered.
- Coverage in Editors > Show Uncovered. Shows only red (uncovered) areas in open Java editors. This is useful for finding out exactly which parts of the code are not being covered while not cluttering your editor with the overwhelming large green areas (covered code).
- Coverage in Editors > Show None. Hides all red/green coverage areas in open Java editors.
- Include passed only If enabled, code coverage from failed tests will not be taken into account.
- Show exclusion annotations If enabled, draws small Clover icons in the Package Explorer view for every source file, indicating whether it's included or excluded from instrumentation.
- Enable Clover Working Set. Enables or disables usage of the Clover working set. This filters the files, directories and projects that Clover will report on and are especially handy for large projects.
- Edit Clover Working Set... Allows you to edit the files, directories and projects in the Clover working set.
- Clear Clover Working Set. Removes all files, directories and projects from the Clover working set.
- About Shows information about Clover version, copyright and licenses.
Note that double-clicking on any element in left or right pane will navigate you directly to the source code.
Test Contributions
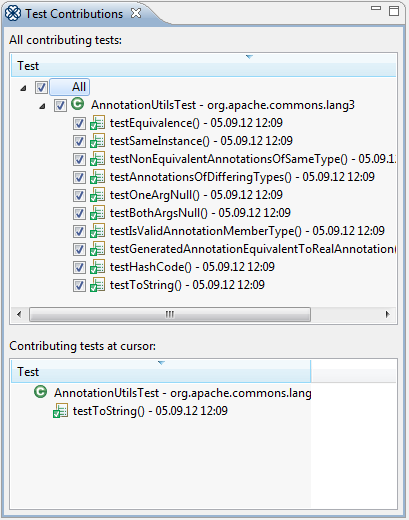
The Test Contributions view shows unit tests and methods that generated coverage for the currently opened and selected Java source file. As you switch between Java source file editors, the top most tree is updated with the test methods that contributed to coverage of this file. Clicking on the any of the tests and their methods will take you to their associated source. Unchecking a test or test method will remove the coverage it provides from the open source file. The bottom tree tracks the test methods that contributed to coverage of the file at the current cursor position.
The Test Contributions view allows you to better understand the relationship between your test code and your application code as you move between Java source files.
You have already learned how to navigate through code coverage and test results. But don't you have a feeling that your coverage reports could be more accurate when focused on really important areas of application? If you do so, don't hesitate to read 4. Scope of instrumentation in Eclipse to learn how to configure instrumentation scope from whole projects down to a single line of code.

