Diagnostics for third-party apps
Administer Bitbucket Data Center and Server
- Users and groups
- Advanced repository management
- External user directories
- Global permissions
- Setting up your mail server
- Integrate with Atlassian applications
- Connect Bitbucket to an external database
- Migrating Bitbucket Server to another server
- Migrate Bitbucket Server from Windows to Linux
- Run Bitbucket in AWS
- Specify the Bitbucket base URL
- Configuring the application navigator
- Managing apps
- View and configure the audit log
- Update your license key
- Configuration properties
- Change Bitbucket's context path
- Data recovery and backups
- Disable HTTP(S) access to Git repositories
- Smart Mirroring
- Bitbucket Mesh
- Export and import projects and repositories
- Git Large File Storage
- Git Virtual File System (GVFS)
- Enable SSH access to Git repositories
- Secret scanning
- Use diff transcoding
- Change the port Bitbucket listens on
- Lockout recovery process
- Proxy and secure Bitbucket
- High availability for Bitbucket
- Diagnostics for third-party apps
- Enabling JMX counters for performance monitoring
- Bitbucket guardrails
- Enable debug logging
- Scaling Bitbucket Server
- Add a shortcut link to a repository
- Administer code search
- Adding additional storage for your repository data
- Add a system-wide announcement banner
- Configuring Project links across Applications
- Improving instance stability with rate limiting
- Use a CDN with Atlassian Data Center applications
- Managing HTTP access tokens
- Link to other applications
- Setting a system-wide default branch name
- Automatically decline inactive pull requests
- Encrypt database password
- Data pipeline
- Monitor application performance
On this page
In this section
Related content
- No related content found
Overview
The Bitbucket Data Center and Server diagnostics tool displays a summary of the alerts that have been raised on the instance in the past 30 days, grouped by issue and app combination.

There are three levels of severity:
- Error: a serious problem has occurred that impacts system stability and/or availability
- Warning: an issue has been detected that impacts performance or can lead to more serious problems in the future
- Info: something worth noting has happened.
The alerts can be filtered by severity, component, app, node and time.
Alert Details

The alert details page is accessed by clicking into an alert, and displays individual alerts for the selected issue and app combination.
When many alerts are raised in a short time window, just one representative alert is displayed per 1 minute window.
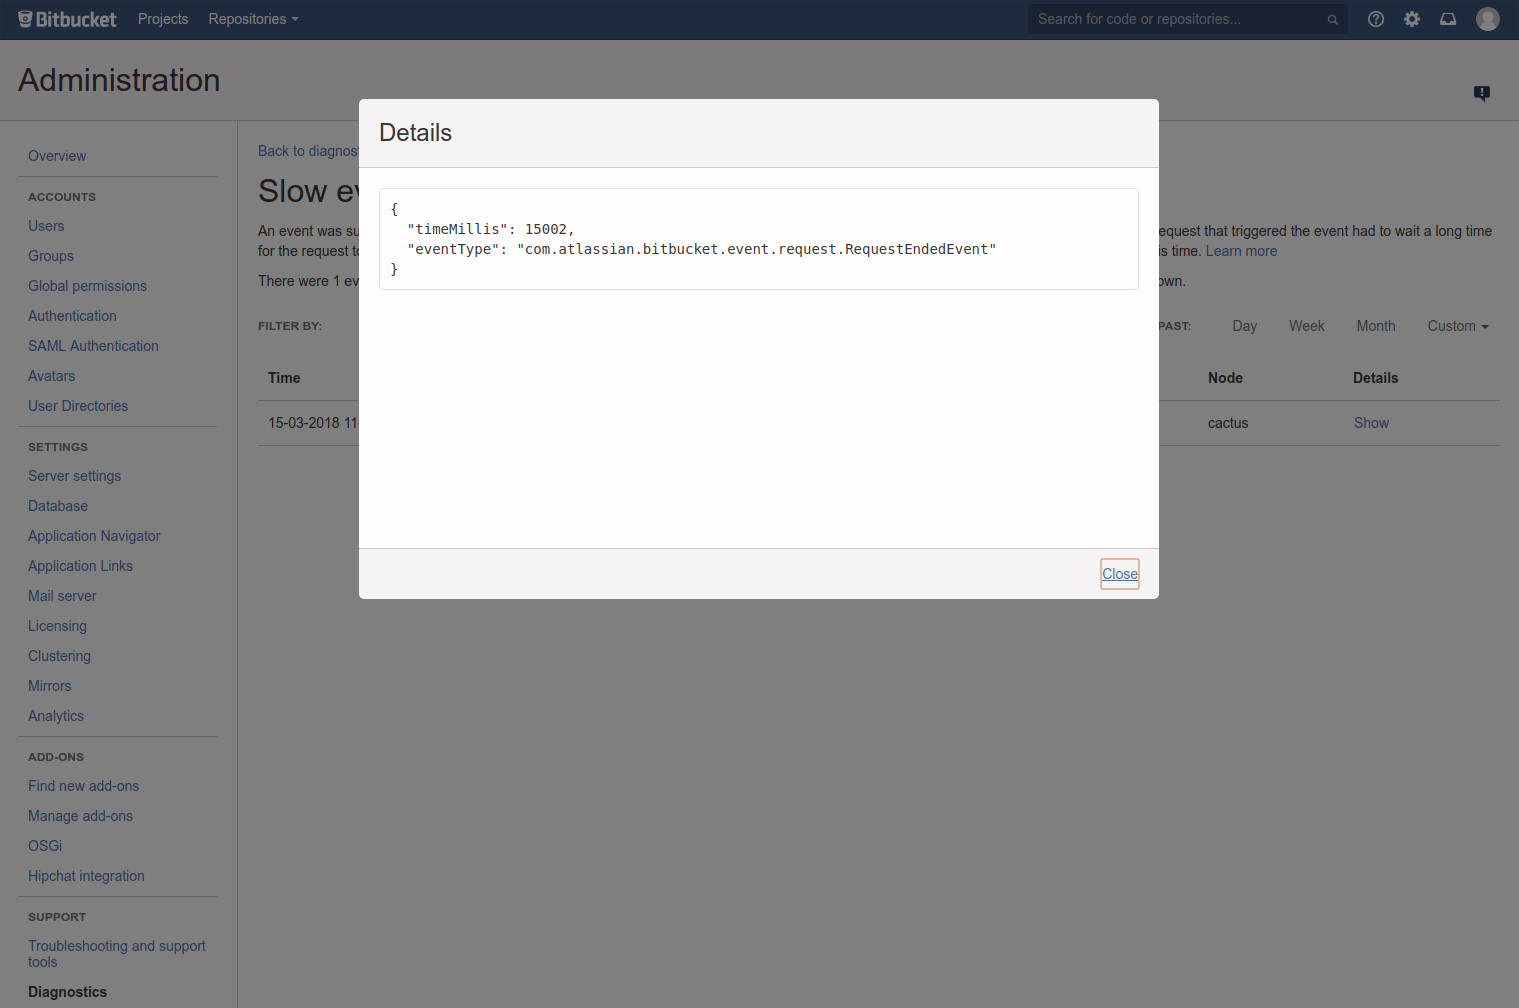
Clicking Show displays information relating to the issue, that was collected when the alert was raised.

You can also set up alerts using JMX metric details.
Last modified on Nov 8, 2022
In this section
Related content
- No related content found
Powered by Confluence and Scroll Viewport.