How to use GROK pattern to parse Bamboo Data Center logs
Platform Notice: Data Center - This article applies to Atlassian products on the Data Center platform.
Note that this knowledge base article was created for the Data Center version of the product. Data Center knowledge base articles for non-Data Center-specific features may also work for Server versions of the product, however they have not been tested. Support for Server* products ended on February 15th 2024. If you are running a Server product, you can visit the Atlassian Server end of support announcement to review your migration options.
*Except Fisheye and Crucible
The steps outlined on this article are provided AS-IS. This means we've had reports of them working for some customers — under certain circumstances — yet are not officially supported, nor can we guarantee they'll work for your specific scenario.
You may follow through and validate them on your own non-prod environments prior to production or fall back to supported alternatives if they don't work out.
We also invite you to reach out to our Community for matters that fall beyond Atlassian's scope of support!
Summary
This page covers few example of how to use Grok Patterns that matches the current Bamboo logging strategy for below log files.
- atlassian-bamboo.log
- atlassian-bamboo-access.log
These Grok patterns are used to help parse Bamboo logs for Indexes like OpenSearch/ELK stack to display these logs into other third party applications.
Environment
The solution was tested on Bamboo 9.2.11 but it will be applicable for other supported version as well.
Solution
You can use the below Grok pattern to parse both the log files.
filter {
    grok {
        break_on_match => true
        match => { "message" => [
            # TestsManagerImpl
            "(?m)%{TIMESTAMP_ISO8601:timestamp} %{LOGLEVEL:log_level} \[%{DATA:thread_name}\] \[%{NOTSPACE:class}\] %{GREEDYDATA}, %{NUMBER:test_classes:int} test classes, %{NUMBER:test_cases:int} test cases, time elapsed: %{NUMBER:time_elapsed:float} %{NOTSPACE:tformat}",

            # BambooAgentMessageListener (always milliseconds)
            "(?m)%{TIMESTAMP_ISO8601:timestamp} %{LOGLEVEL:log_level} \[%{DATA:thread_name}\] \[%{NOTSPACE:class}\] Processing of message took %{NUMBER:agent_message_time_elapsed:int}ms, %{GREEDYDATA:msg}",

            # ArtifactServlet
            "(?m)%{TIMESTAMP_ISO8601:timestamp} %{LOGLEVEL:log_level} \[%{DATA:thread_name}\] \[%{NOTSPACE:class}\] Artifact processing was longer by %{NUMBER:artifact_time_elapsed:int}s than artifact publish, looks like your server is under load or the disk holding the artifact directory is too slow. Deserialisation itself took %{NUMBER:artifact_deserialisation:int}s",

            # generic (catches most messages)
            "(?m)%{TIMESTAMP_ISO8601:timestamp} %{LOGLEVEL:log_level} \[%{DATA:thread_name} url: %{NOTSPACE:thready_url}, %{NOTSPACE:thready_url2}; user: %{NOTSPACE:user}\] \[%{NOTSPACE:class}\] %{GREEDYDATA:msg}",
            "(?m)%{TIMESTAMP_ISO8601:timestamp} %{LOGLEVEL:log_level} \[%{DATA:thread_name} url: %{NOTSPACE:thready_url}; user: %{NOTSPACE:user}\] \[%{NOTSPACE:class}\] %{GREEDYDATA:msg}",
            "(?m)%{TIMESTAMP_ISO8601:timestamp} %{LOGLEVEL:log_level} \[%{DATA:thread_name} url: %{NOTSPACE:thready_url}\] \[%{NOTSPACE:class}\] %{GREEDYDATA:msg}",

            # catches everything else and tags unparsed messages with msg_unparsed
            "(?m)%{TIMESTAMP_ISO8601:timestamp} %{LOGLEVEL:log_level} \[%{DATA:thread_name}\] \[%{NOTSPACE:class}\] %{GREEDYDATA:msg}",
            "(?m)%{TIMESTAMP_ISO8601:timestamp} %{GREEDYDATA:msg_unparsed}"
            ]
        }
    }
filter {
    grok {
        match => { "message" => [
            # Bamboo filters
            "(?m)%{TIMESTAMP_ISO8601:timestamp} %{LOGLEVEL:log_level} \[%{DATA:thread_name} url:( %{NOTSPACE:thready_url})?(?: username:%{NOTSPACE:thready_username}|)(?:( ...)+|)( %{NOTSPACE:thready_url2})?\] \[%{NOTSPACE:class}\] %{NOTSPACE:user} %{NOTSPACE:request_method} %{URI:request_url} %{NUMBER:request_size:int}kb",
            "(?m)%{TIMESTAMP_ISO8601:timestamp} %{LOGLEVEL:log_level} \[%{DATA:thread_name} url: %{NOTSPACE:thready_url}\] \[%{NOTSPACE:class}\] %{NOTSPACE:user} %{NOTSPACE:request_method} %{URI:request_url} %{NUMBER:request_size:int}kb",
            "(?m)%{TIMESTAMP_ISO8601:timestamp} %{LOGLEVEL:log_level} \[%{DATA:thread_name}\] \[%{NOTSPACE:class}\] %{NOTSPACE:user} \[%{GREEDYDATA:access_token}\] %{NOTSPACE:request_method} %{URI:request_url} %{NUMBER:request_size:int}kb",
            "(?m)%{TIMESTAMP_ISO8601:timestamp} %{LOGLEVEL:log_level} \[%{DATA:thread_name}\] \[%{NOTSPACE:class}\] %{NOTSPACE:user} %{NOTSPACE:request_method} %{URI:request_url} %{NUMBER:request_size:int}kb",
            "%{COMMONAPACHELOG:unparsed_msg2} %{GREEDYDATA:unparsed_msg}",
            "(?:%{GREEDYDATA:unparsed_msg2}|)%{TIMESTAMP_ISO8601:timestamp}%{GREEDYDATA:unparsed_msg}",
            "(?m)%{TIMESTAMP_ISO8601:timestamp} %{GREEDYDATA:msg_unparsed}"
            ]
        }
    }
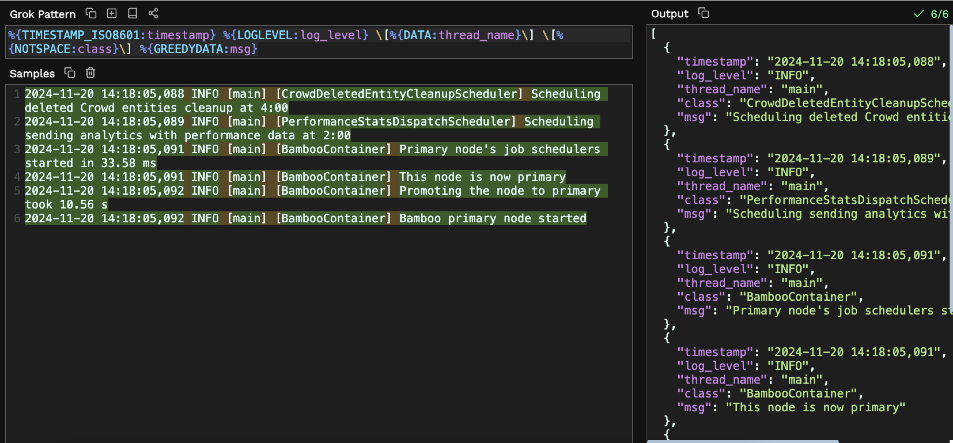
You can use https://grokdebugger.com/ to test any pattern and see how the output looks like ( please note this is a external website, please use this with caution before pasting any logs ).
Example :
%{TIMESTAMP_ISO8601:timestamp} %{LOGLEVEL:log_level} \[%{DATA:thread_name}\] \[%{NOTSPACE:class}\] %{GREEDYDATA:msg}
