General troubleshooting guide for Jira automation
Platform notice: Server and Data Center only. This article only applies to Atlassian products on the Server and Data Center platforms.
Support for Server* products ended on February 15th 2024. If you are running a Server product, you can visit the Atlassian Server end of support announcement to review your migration options.
*Except Fisheye and Crucible
Configuring and troubleshooting automation rules using Jira automation (formerly known as Automation for Jira) can be a challenge. The purpose of this page is to list all the useful resource and links that will help you depending on the type of challenge you are facing.
On this page:
- Environment
- Configuring an automation rule based on a complex use case
- Investigating automation rule execution issues
- Symptom 1 - The rule was not triggered
- Symptom 2 - The rule was triggered twice instead of just once
- Symptom 3 - The rule failed to complete with the SOME ERRORS status
- Symptom 4 - The rule failed to complete with the FAILURE status
- Symptom 5 - The rule failed to complete with the IN PROGRESS status
- Symptom 6 - The rule completed with the SUCCESS status but did not provide the expected outcome
- Symptom 7 - The rule completed with the SUCCESS status, but was triggered with a long delay (and the automation queue is piling up)
- Investigating issues related to the Jira automation upgrade
- Miscellaneous issues
- Useful troubleshooting data
- Providing data to Atlassian Support
Environment requirements
Starting from Jira Data Center 10.0, we integrated Jira automation (formerly Automation for Jira) as part of Jira Data Center (both Software and Service Management), offering you the convenience of upgrading either through Jira or the Universal Plugin Manager (UPM). To streamline and enhance your experience with Jira automation, we've made the decision to solely offer it as a bundled version starting from Jira 10.0.
This guide assumes that you're using:
- Jira Data Center 8.0.0 or later
- Jira automation Data Center 7.4.0 or later
Configuring an automation rule based on a complex use case
![]() You have a complex use case, and you are not sure what is the best way to turn it into an automation rule?
You have a complex use case, and you are not sure what is the best way to turn it into an automation rule?
![]() In this case, we advise that you open the article below, since it includes more than 50 rule templates, and it is actively updated with new examples. It is a great starting point, as you might find a template that is close to what you are trying to achieve.
In this case, we advise that you open the article below, since it includes more than 50 rule templates, and it is actively updated with new examples. It is a great starting point, as you might find a template that is close to what you are trying to achieve.
Investigating automation rule execution issues
![]() You already configured your automation rule but it is not working, meaning that it did not run, failed to run, or did not lead to the expected result? You already went through the basic steps listed in Troubleshoot Automation Rules, but they did not help?
You already configured your automation rule but it is not working, meaning that it did not run, failed to run, or did not lead to the expected result? You already went through the basic steps listed in Troubleshoot Automation Rules, but they did not help?
![]() In this case, we need to first identify the type of problem, and then move on to the relevant section of this page based on the problem:
In this case, we need to first identify the type of problem, and then move on to the relevant section of this page based on the problem:
- Go to the Audit Logs page of the rule:
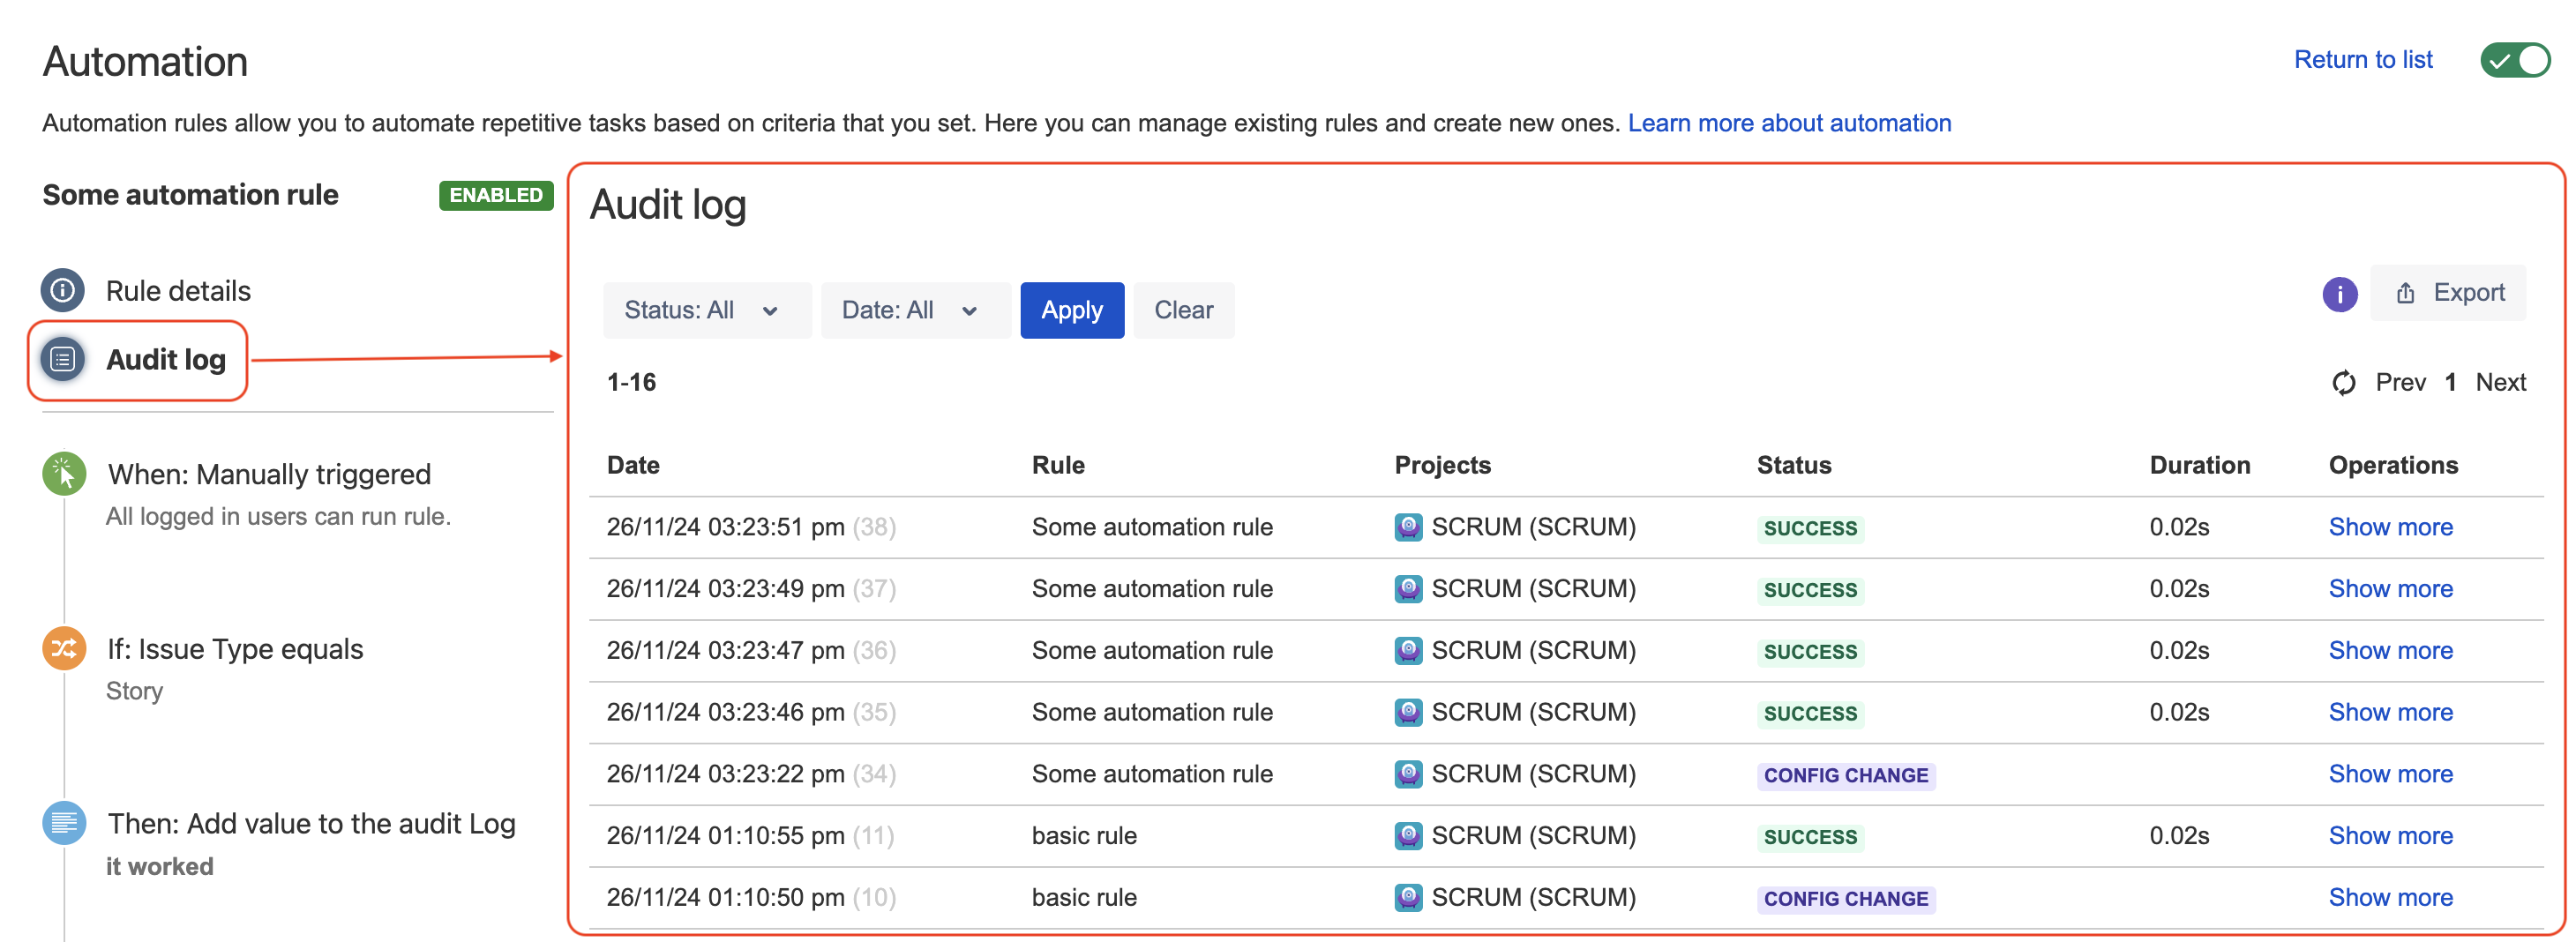
- Look for an entry at the time when the rule was supposed to be executed:
- If you do not find any entry at the time when you expected the rule to be triggered, move on to the Symptom 1 section
- If you find more than 1 entry at the time when you expected the rule to be triggered (the rule was triggered duplicated times), move on to the Symptom 2 section
- If you are able to find 1 entry in the audit logs, check the status of the rule execution and move on to the section that addresses this status (from the Symptom 3 to the Symptom 7 section)
- If you do not find any entry at the time when you expected the rule to be triggered, move on to the Symptom 1 section
Symptom 1 - The rule was not triggered
For this type of issue, please check the KB article linked below, which lists all the known root causes so far:
Troubleshooting guide for situations where automation rules are not triggered
If this article does not help, we recommend reaching out to Atlassian Support and provide us with the necessary data as explained in Providing Data to Atlassian Support.
Symptom 2 - The rule was triggered twice instead of just once
You can find below the scenarios which are known to cause a duplicate execution of a rule:
- Actions are duplicated when the Field Value Changed is triggered
- Automation rule is triggered twice and fails with the error "Error marking step #XXXXX finished"
Symptom 3 - The rule failed to complete with the SOME ERRORS status
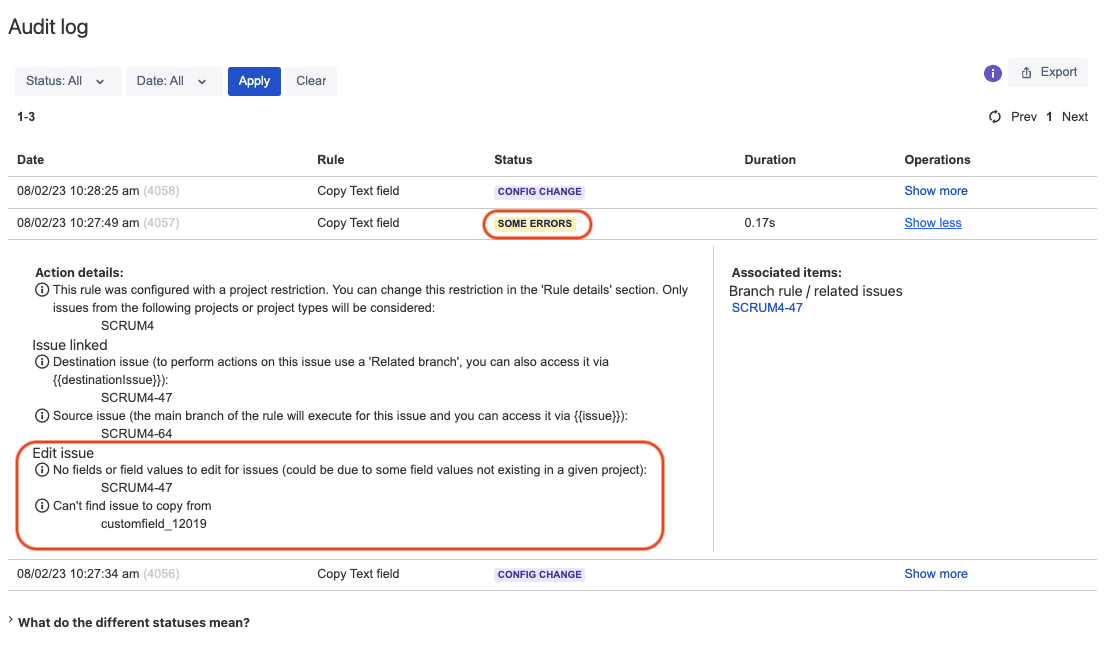
If the rule was triggered but failed with the SOME ERRORS status, check the error found in the audit logs and look for it the KB article linked below:
Troubleshooting the most common errors reported in the rule audit logs
Symptom 4 - The rule failed to complete with the FAILURE status
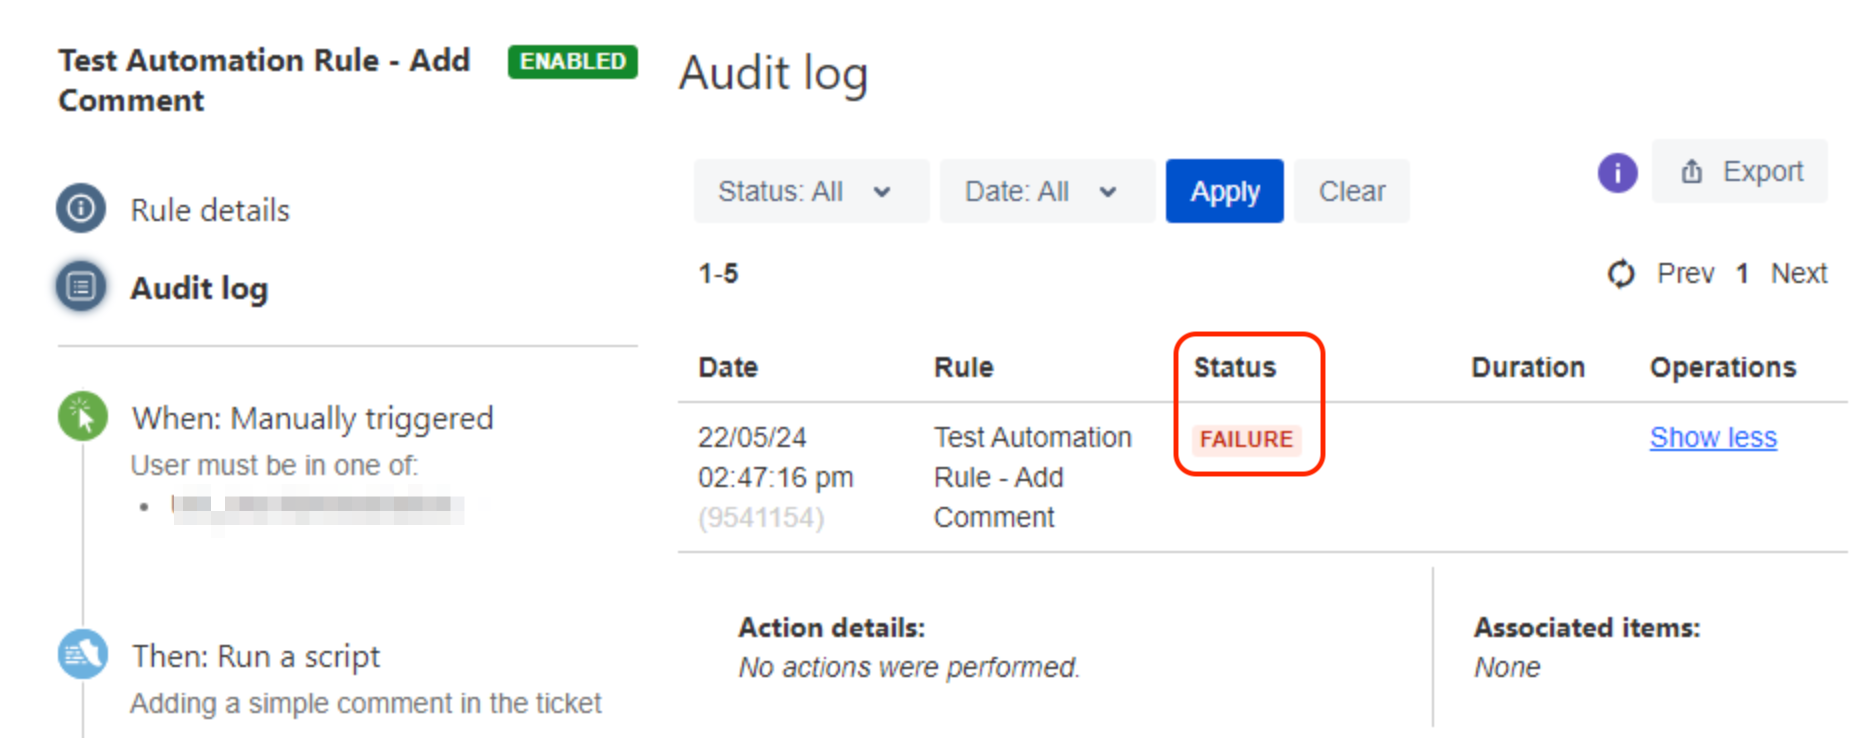
If the rule was triggered but failed with the FAILURE status, check the error found in the audit logs (if any) and look for it the KB article linked below:
Troubleshooting the most common errors reported in the rule audit logs
Symptom 5 - The rule failed to complete with the IN PROGRESS status
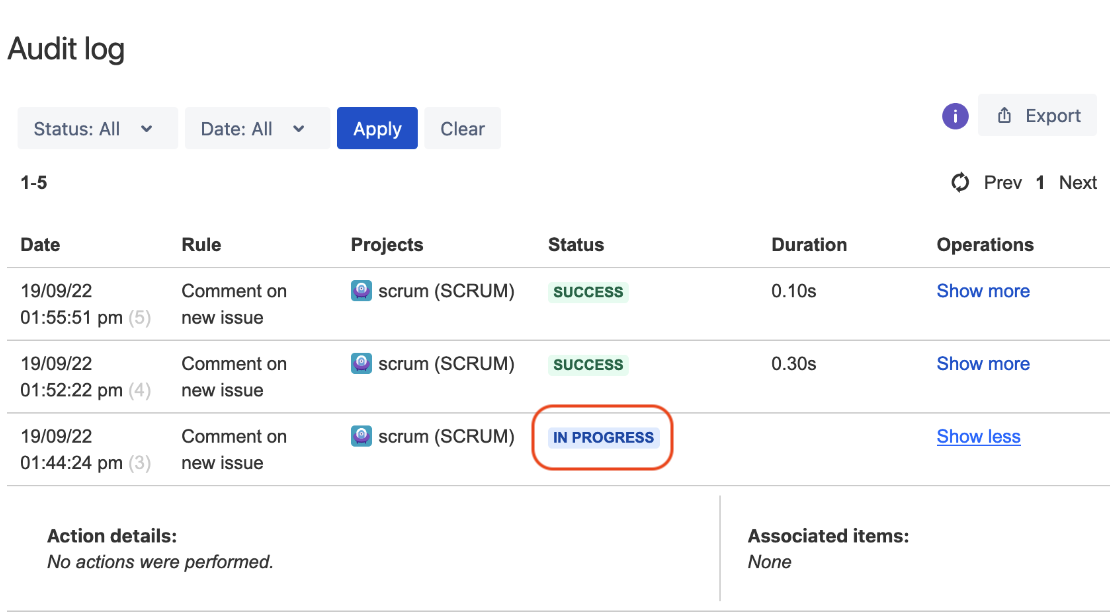
There can be various reasons why a rule is showing as stuck IN PROGRESS. The 2 most common root causes are documented in the links below:
- A rule execution may still be reported as "in progress" by audit logs and performance insight despite not being running anymore (Jira bug)
- All the rules are stuck in the "In Progress" status when using an Oracle Database
Symptom 6 - The rule completed with the SUCCESS status but did not provide the expected outcome
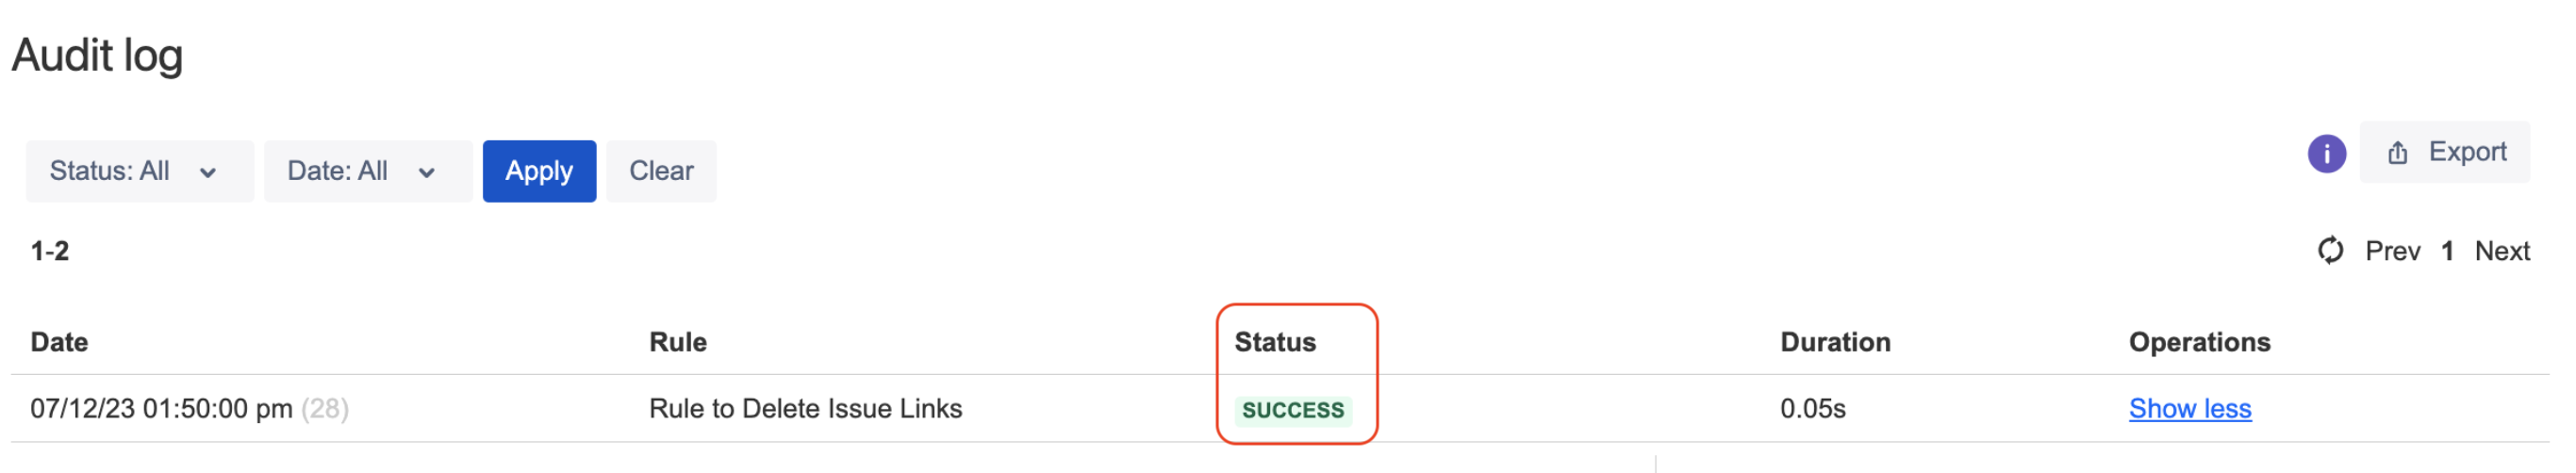
Even if the automation rule shows the SUCCESS status in the audit logs, it does not necessarily mean that the automation rule provided the outcome that you were expecting.
Expand the section below to check how to investigate this type of situation:
Symptom 7 - The rule completed with the SUCCESS status, but was triggered with a long delay (and the automation queue is piling up)
Expand the section below to check how to investigate this type of symptom:
Investigating issues related to Jira automation upgrade
When upgrading Jira automation from 8.x to 9.x, or when upgrading to Jira to 9.11.x (which is bundled with Jira automation 9.x), you might run into various issues, such as the inability to edit or publish automation rules.
If you face any of these problems, we recommend checking the 2 articles below which address these symptoms and how to fix them:
- Rules cannot be enabled/saved after an upgrade due to the error 'An unknown error occurred. Please reload and try again'
- Rules fail to run or can't be enabled/edited due to the error 'Provided URL is not present in Jira allowlist or request from anonymous users is not enabled'
- Automation for Jira shows up as incompatible in the UPM
- Automation rules suddenly disappeared without being deleted by anyone
- Automation rules fail with the "FAILURE" status and without any error after an upgrade
If these articles don't help, we recommend reaching out to Atlassian Support and provide us with the necessary data as explained in Providing Data to Atlassian Support.
Miscellaneous issues
If the issue you are facing is not covered by any of the scenario and article listed above, you might want to take expand the section below and look at the issues listed there:
Useful troubleshooting data
Database tables and SQL queries
The Jira automation (Automation For Jira) DB tables are stored in table which name starts with AO_589059_.
- Tables starting with AO_589059_RULE_ are mostly related to rule configuration
- Tables starting with AO_589059_AUDIT_ are related to the rule audit logs
- Tables starting with AO_589059_RULE_STAT_ are related to rule execution statistics
- The table AO_589059_AUTOMATION_QUEUE contains the items/events added to the automation queue
You can find below the list of KB article which provides examples on how to query these tables:
- Identify list of rules with their creator's username and created date
- Identify list of rules by Trigger or Action in Jira
- Identify all rules executed by an specific actor
- Identify the number rule execution over the past 30 days
- Identify the rules that updated or created a Jira issue or that were triggered from it
Automation Threads
Below is the list of all the automation threads which come by default with Jira automation (Automation For Jira):
automation-event-serializer:thread-1
automation-event-serializer:thread-2
automation-queue-claimer:thread-1
automation-rule-executor:thread-1
automation-rule-executor:thread-2
automation-rule-executor:thread-3
automation-rule-executor:thread-4
automation-rule-executor:thread-5
automation-rule-executor:thread-6
automation-TaskTimer:thread-1![]() Please note that the number of threads might differ from the list below, since this number can be modified as per Automation Service Limits.
Please note that the number of threads might differ from the list below, since this number can be modified as per Automation Service Limits.
The purpose of each main category of Jira automation threads is described below:
- Event Serializer threads (
automation-event-serializer:thread-X)- They listen to Jira issue events, serialize them and store them in the Jira automation queue in the table AO_589059_AUTOMATION_QUEUE
Queue Claimer thread (
automation-queue-claimer:thread-1)It reads the events queued in the database
Then it passes the events to the executor threads
Event executor threads (
automation-rule-executor:thread-X)They receive the event from the queue claimer thread
They execute the Automation rule(s) that should be triggered from that event
They add an entry in the audit log
Debug packages
In case you are trying to troubleshoot situations where automation rules are either not triggered or triggered with a delay, enabling the packages below with the DEBUB level (via the page ⚙ > System > Logging and Profiling) might help:
com.codebarrel.automation
com.codebarrel.jira.plugin.automation![]() Note that, due to the verbosity of such DEBUG packages, it is recommended to only enable them for a short period of time. Alternatively, you might consider enabling the less verbose packages listed below:
Note that, due to the verbosity of such DEBUG packages, it is recommended to only enable them for a short period of time. Alternatively, you might consider enabling the less verbose packages listed below:
com.codebarrel.automation.api.service
com.codebarrel.automation.rulecomponent.jira
com.codebarrel.jira.plugin.automation.event
com.codebarrel.jira.plugin.automation.queue
Providing data to Atlassian Support
If none of the article listed below helped investigate the issue you are facing, we recommend reaching out to Atlassian Support and provide the information below: