Jira cluster monitoring
If your Jira Data Center is clustered, you can easily use Jira tools to know how the nodes are doing.
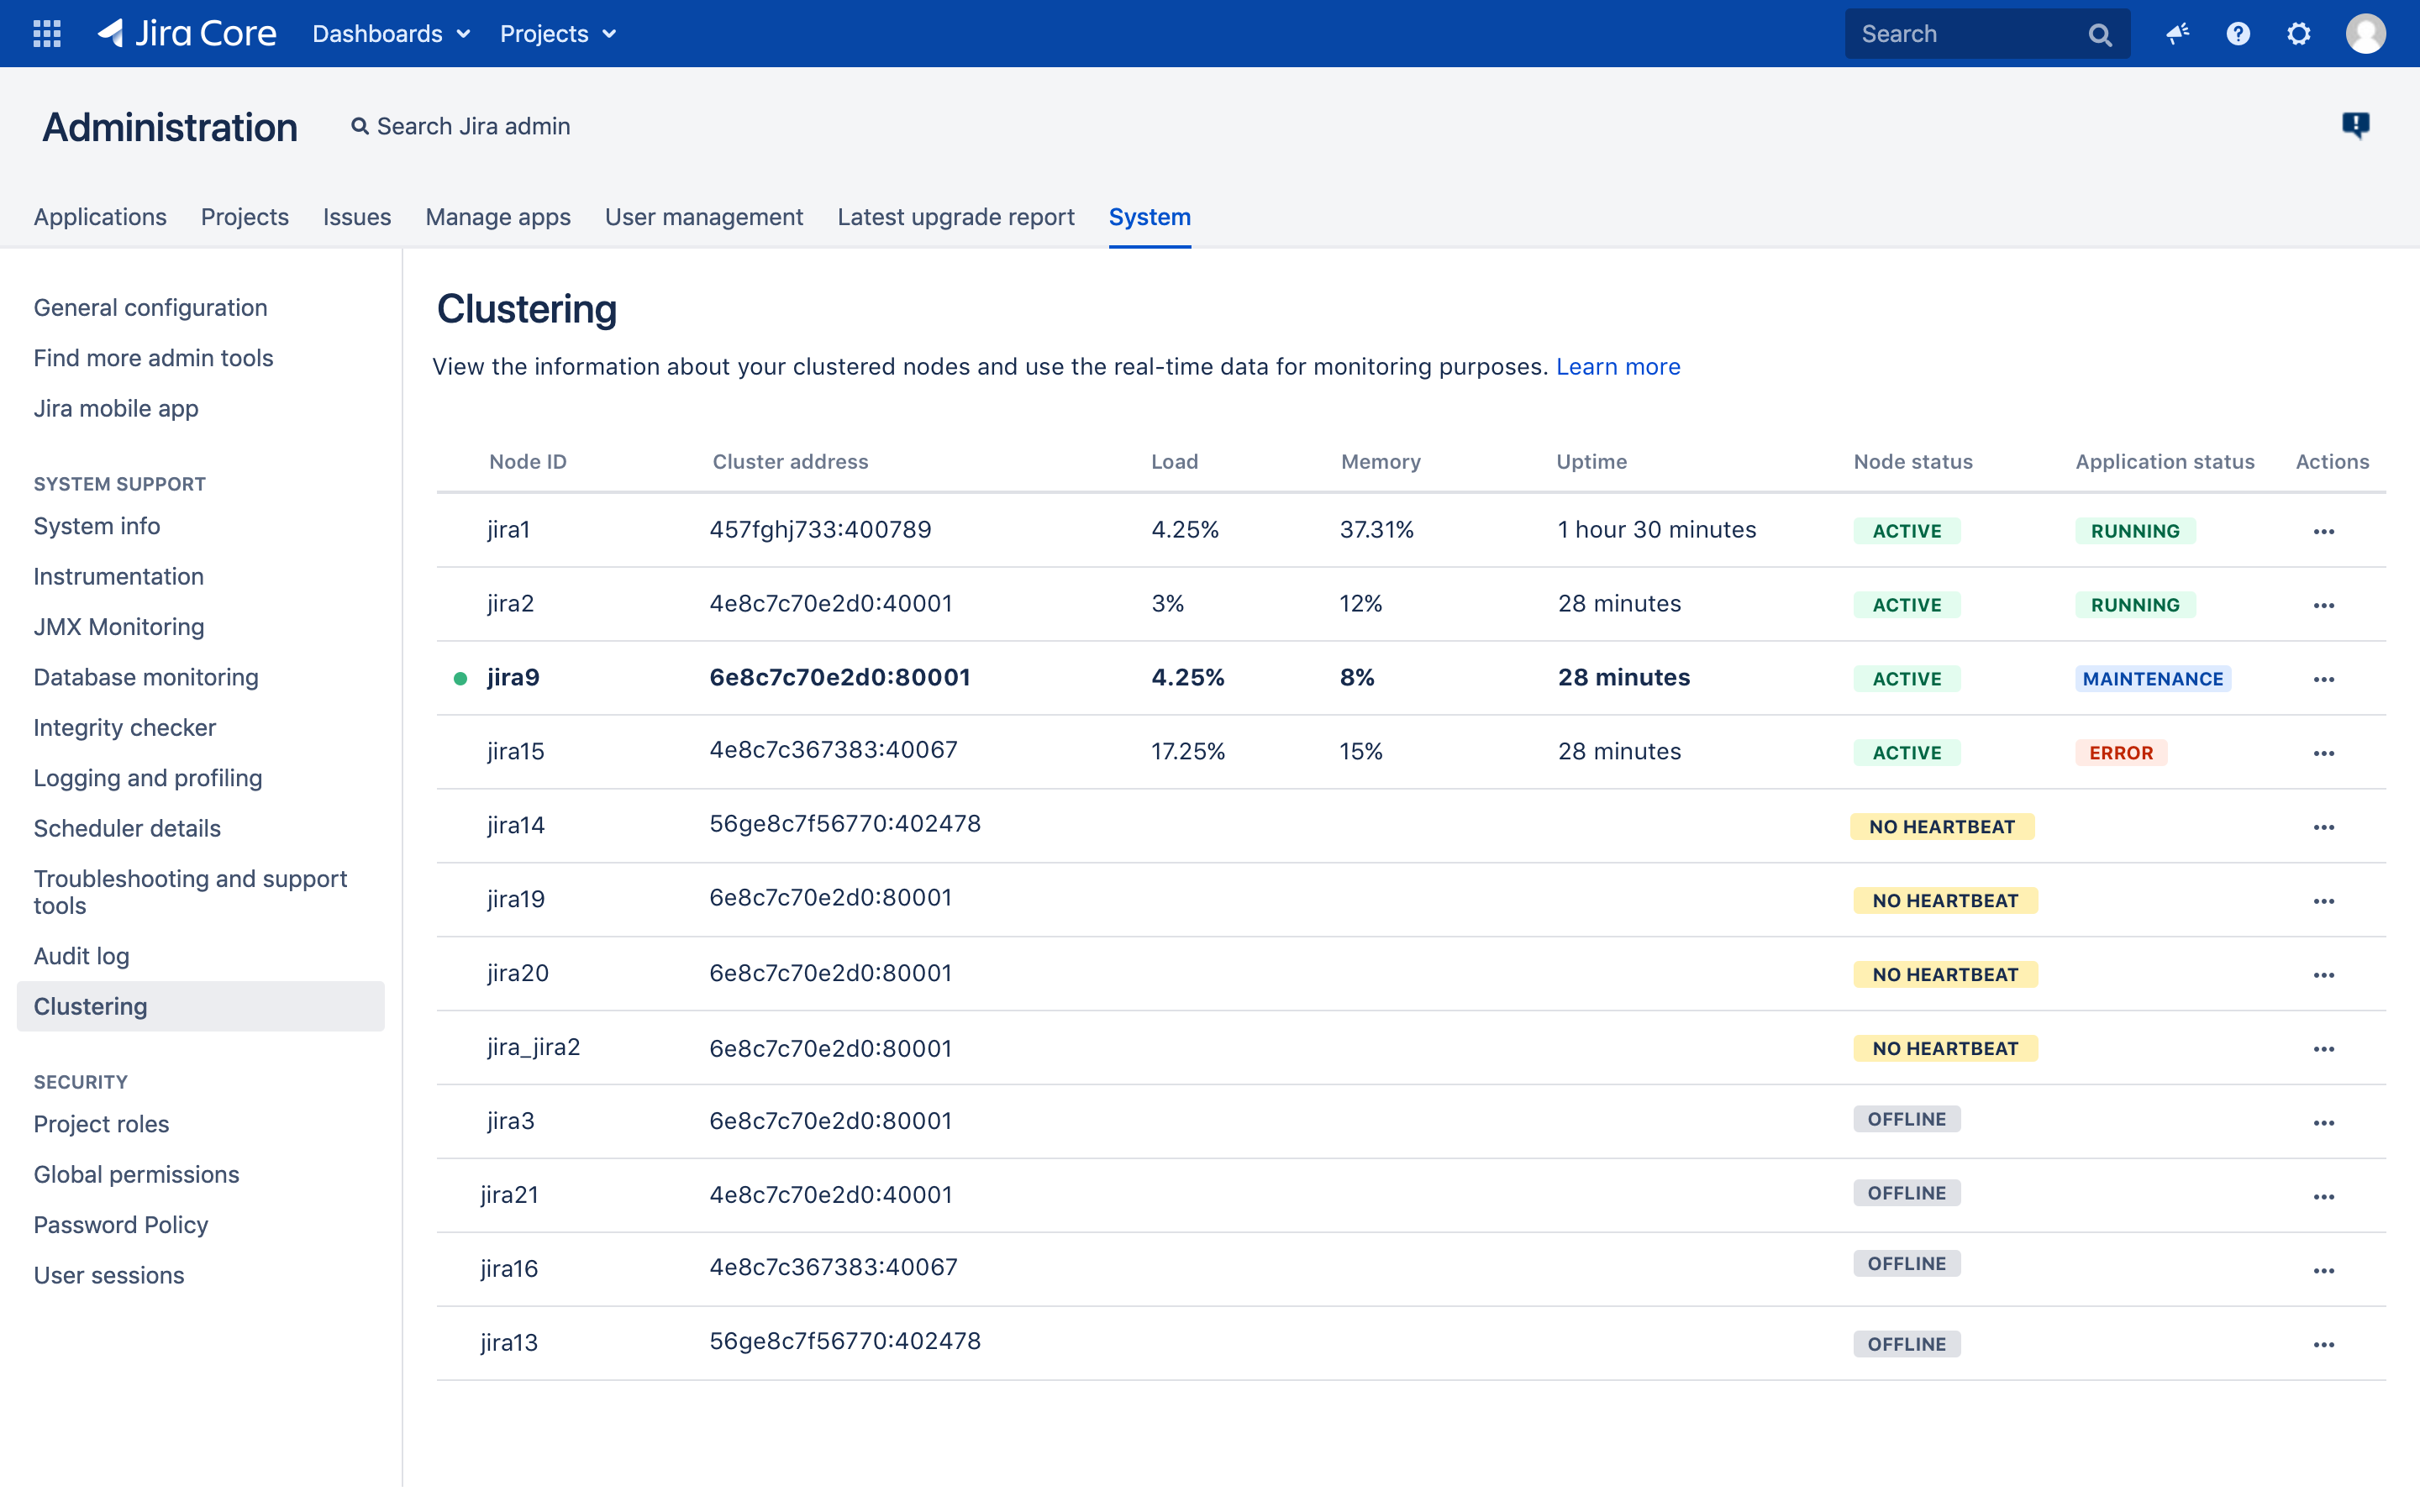
The new Cluster monitoring page available to Jira system administrators gathers real-time data such as node ID, address, uptime (since last restart), load (system load average for the last minute), and memory. The information available on the page can also help you decide if a node you've just added to the cluster has been configured correctly.
Skip directly to:
- Monitor the status and health of your node
- View cluster information in the audit log
- View runtime and system info
- View the custom fields that take longest to index
View your clustered nodes
To see the information about your clustered nodes, go to Jira Administration > System > Clustering. For more on Jira clustering, see Configuring a Jira cluster.
The node marked with a green dot is the one you’re currently on.
Monitor the status and health of your node
- ACTIVE: the node is active and has heartbeat.
jira.cluster.node.self.shutdown.if.offline.disabled=true property.
NO HEARTBEAT: the node is temporarily down, has been killed, or is active but failing. This state might be caused by automatic deployment. It might also happen that the server is starting and the No heartbeat status is temporary. Normally, a node is moved to this state after 5 minutes of reporting no heartbeat. You can check if a node is really down and decide if you want to restart it, or remove it right away through REST API.
If a node is killed abruptly, it might still show as active for about 5 minutes before changing the status to No heartbeat.
By default, after two days if reporting the No heartbeat state the node is automatically moved offline. However, you can change the default by modifying the jira.not.alive.active.nodes.retention.period.in.hours system property. Alternatively, you can add a JVM flag on Jira startup. For example, if you want the node to go offline after 3 hours, enter the following flag:
Djira.not.alive.active.nodes.retention.period.in.hours=3The value for jira.not.alive.active.nodes.retention.period.in.hours should be grater than the Jira instance start-up time otherwise other nodes in the cluster could move the node to the OFFLINE state.
- OFFLINE: the node has been manually fixed or stopped, and moved offline. The node should not be used to run cluster jobs. Once moved offline, the node is automatically removed from cluster after two days.
jira.cluster.state.checker.job.disabled=true property. Additionally, if you want to use your own scripts, you can use the API described here.
Application status
The responses are refreshed every minute on the server side. Refresh the page to get the latest data. If a node is offline or has no heartbeat, the Application status column does not contain any data.
MAINTENANCE: Jira on the node is being reindexed and cannot currently serve users.
ERROR: something went wrong on startup and Jira is not running on this node. The error might have been caused by multiple reasons such as: the database couldn't be reached, or a lock file is found. Check the log files for details.
RUNNING: the node is up and Jira is running on it.
STARTING: the node with Jira is starting up.
Cluster information in the audit log
To help you manage your cluster, you can also find the information on nodes leaving or joining the cluster in your Audit log.
To collect these events, set the Global configuration and administration coverage area to Full:
Go to Jira administration > System > Audit log.
- On the Advanced audit log admin page, click > Settings.
- Under Coverage, set the Global configuration and administration coverage area to Full, and then click Save.
To see the logged cluster-related events, go to Jira administration > System > Audit log, and then search for the "clustering" keyword.
We log the following events:
- - NodeJoined - a new node has joined the cluster
- - NodeReJoined - an existing node was restarted and re-joined the cluster
- - NodeLeft - a node received the OFFLINE status
- - NodeRemoved - a node was removed from the cluster
- - NodeUpdated - all other cases when existing node was updated
View runtime and system info
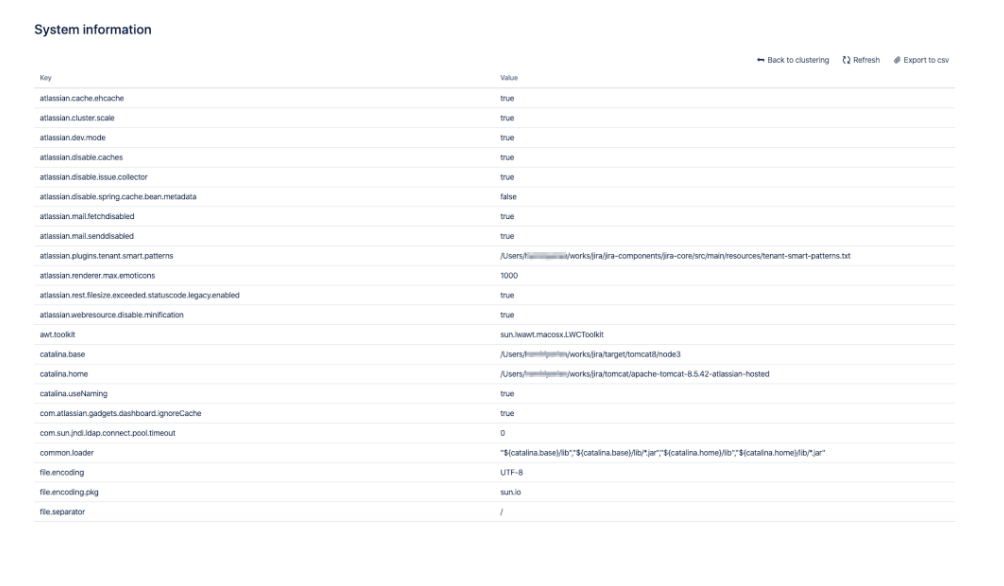
To drill down and see runtime and system information, click Actions for a specific node.
View the custom fields that take longest to index
When you experience a sudden degradation in indexing performance, it might be because a custom field takes long to index. Normally, re-indexing time is not evenly distributed and there are several fields which take up most of the indexing time.
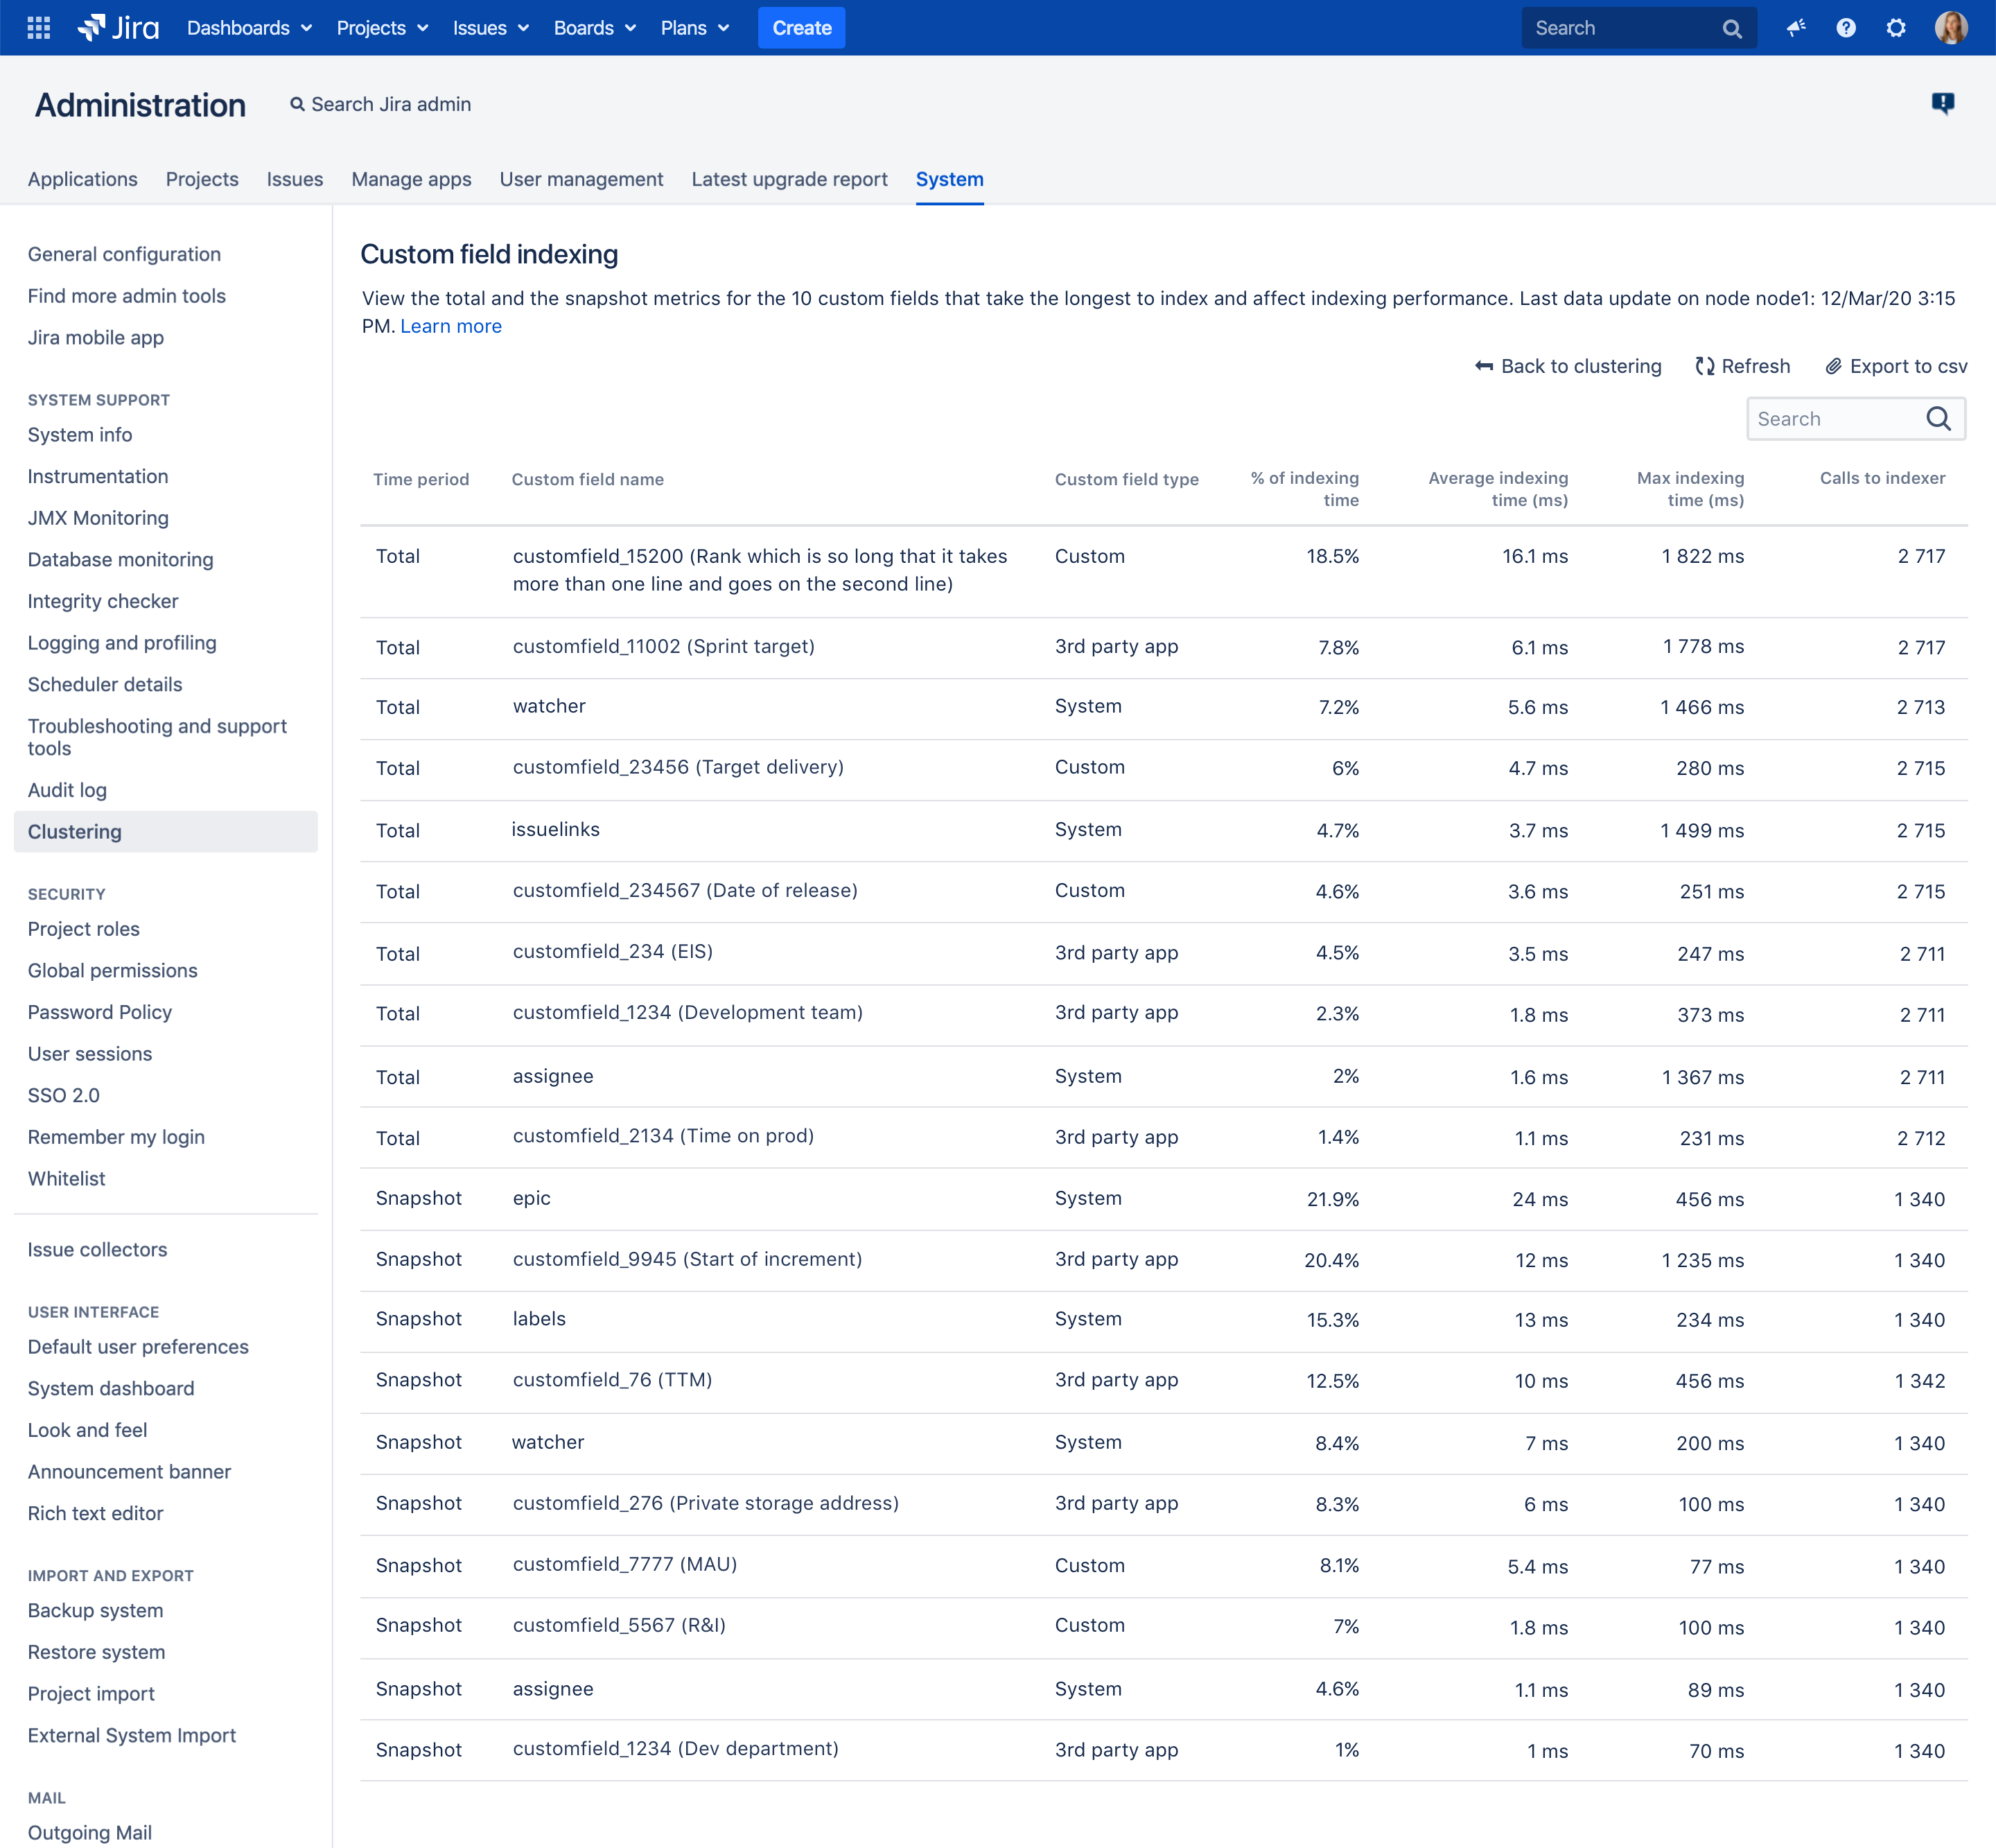
To find out which custom fields might take longest to index, you can look up the metrics in the logs (available in Jira 8.10 and later) or click Actions > Custom field indexing for a specific node to view this data in the UI. The page displays the 20 most time-consuming custom fields (10 in the Total and 10 in the Snapshot time period).
The information which custom fields take up the majority of the indexing time allows you to take action to improve the performance. You might try changing the custom field’s configuration or, if possible, improve the custom field indexer itself. If it’s a custom field that’s not crucial to your business and it’s not a system custom field, you might try removing it in the test environment and see what indexing time gain you can achieve.
Best practices for analyzing metrics
It’s a good idea to refer to these metrics every time you introduce a configuration change or you make changes to the system in your test environment. If you’re about to analyze the report, consider the following best practices:
To get reliable data, we recommend looking at the report after a full background re-index finished.
It’s a good idea to analyze reports where there are more calls to indexer than the number of issues on an instance as this is the best quality data.
Before introducing any changes, look at the values in the Max indexing time column in the Snapshot section. The custom fields that score high there (for example reach 5000 miliseconds - 5 secs - or more) are the ones that tend to be most expensive index-wise.
Analyze performance data
The table displays the custom fields that take longest to index or re-index (10 for Total and 10 for Snapshot). The data is displayed per node so it might be different depending on the node you select on the Clustering page. The data is refreshed in the background every 5 minutes. You can refer to the timestamp to see when the last indexing data update was sent by the system.
The data is sorted by indexing cost starting with the most time-consuming custom field in Total and in the Snapshot sections.
The table contains the following data:
Time period: sets the timeframe for the presentation of the data. Total is the time from the last full re-index or the start of Jira (if there was no full re-index since that time). Snapshot presents a 5-minute-timeframe (time from the last snapshot).
Custom field name: is the name of the custom field as used in JQL.
Custom field type: is the type of the custom field:
- System is a custom field used by the system. You cannot change its configuration or its indexing time.
- 3rd party app is a custom field coming from a 3-rd party app you use. If it takes long to index, you might try changing its configuration or contact the vendor to improve the custom field indexer.
- Custom is a custom field that has been created on your instance. If it takes long to index, you might try changing its configuration or improve the custom field indexer.
% of the indexing time: is the % of time spent indexing or re-indexing a given custom field. It shows how a custom field affects indexing time.
Max indexing time (ms): is the maximum time spent indexing or re-indexing a given custom field.
Average indexing time (ms): is the average time spent indexing or re-indexing a given custom field. It's the sum in milliseconds of all the calls to indexer divided by the number of these calls.
Calls to indexer: is how many times the custom field indexer was called in a time period to re-index a given custom field.
Further analysis
To get more insights, you might also analyse the logs (available in Jira 8.1 and later):
Go to atlassian/application-data/jira/log/atlassian-jira.log
Use grep indexing-stats to find the data. It might look in the following way:
Regular log entry:
{field: epic, addIndex: {sum/allSum:38.5%, sum:1285825ms, avg:30.1ms, max:3822ms, count:42717}},Re-indexing log entry:
where:
order - fields that are indexed/re-indexed are displayed according to how long it took to index/re-index them
sum/allSum - is the % of time spent indexing a custom field vs all custom fields
addIndex sum / avg / max / count - is the the total time spent indexing a custom field / the average time spent indexing a custom field / maximum time spent indexing a custom field / calls to indexer
totalIndexTime - is the total indexing/re-indexing time
addIndexSum/totalIndexTime - is the cost (in time) of indexing/reindexing this field vs the total indexing/re-indexing time
numberOfIndexingThreads - number of indexing threads
For further explanation of the log stats, see Indexing stats.


